Electrical Overview
The Electrical Cause, Already on Screen
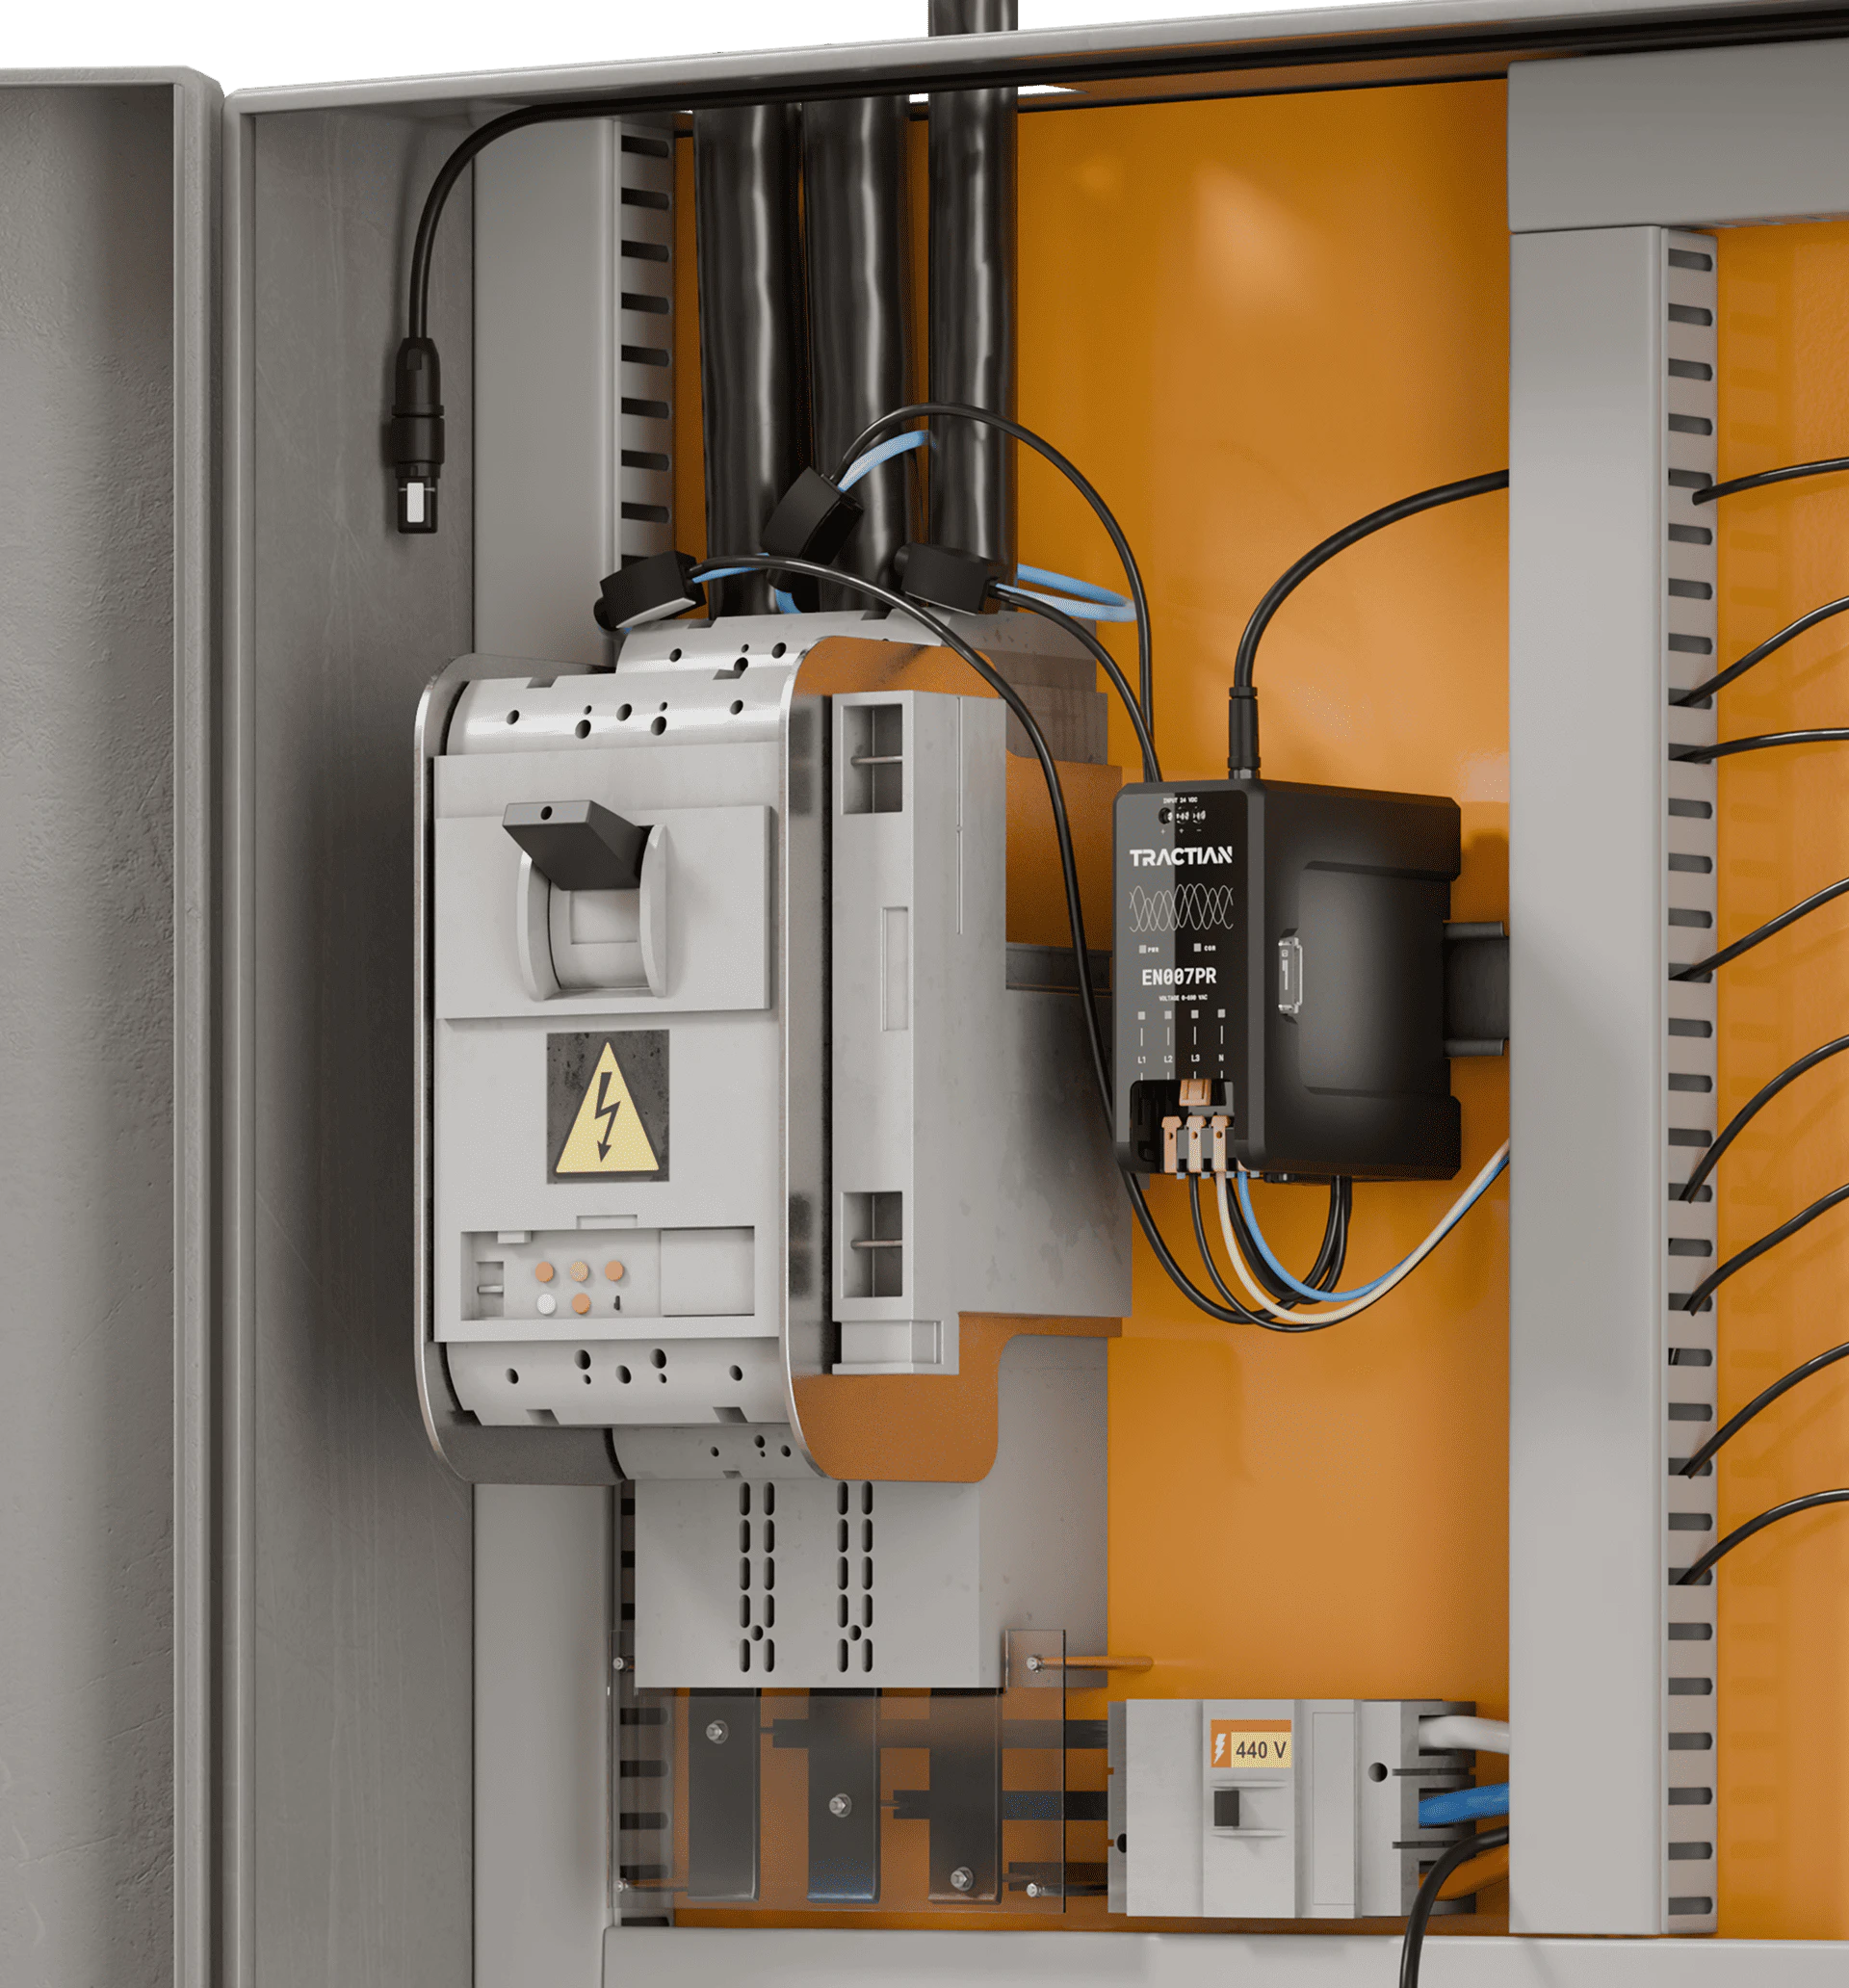
Current per phase, voltage per phase, power factor, detected faults, live for every monitored asset. Timestamped from first symptom.
All Your Electrical Data. One Screen.
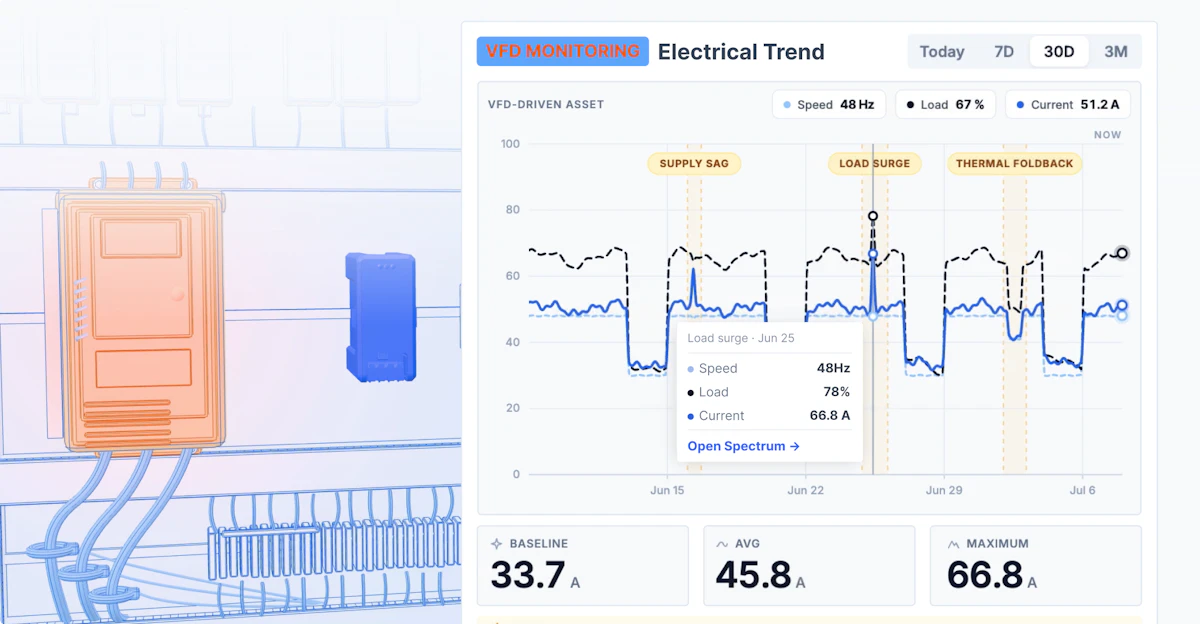
See electrical faults as they develop, not after they trip. Current per phase, power quality, and detected faults on one screen with severity tracked from first symptom.


Electrical Overview
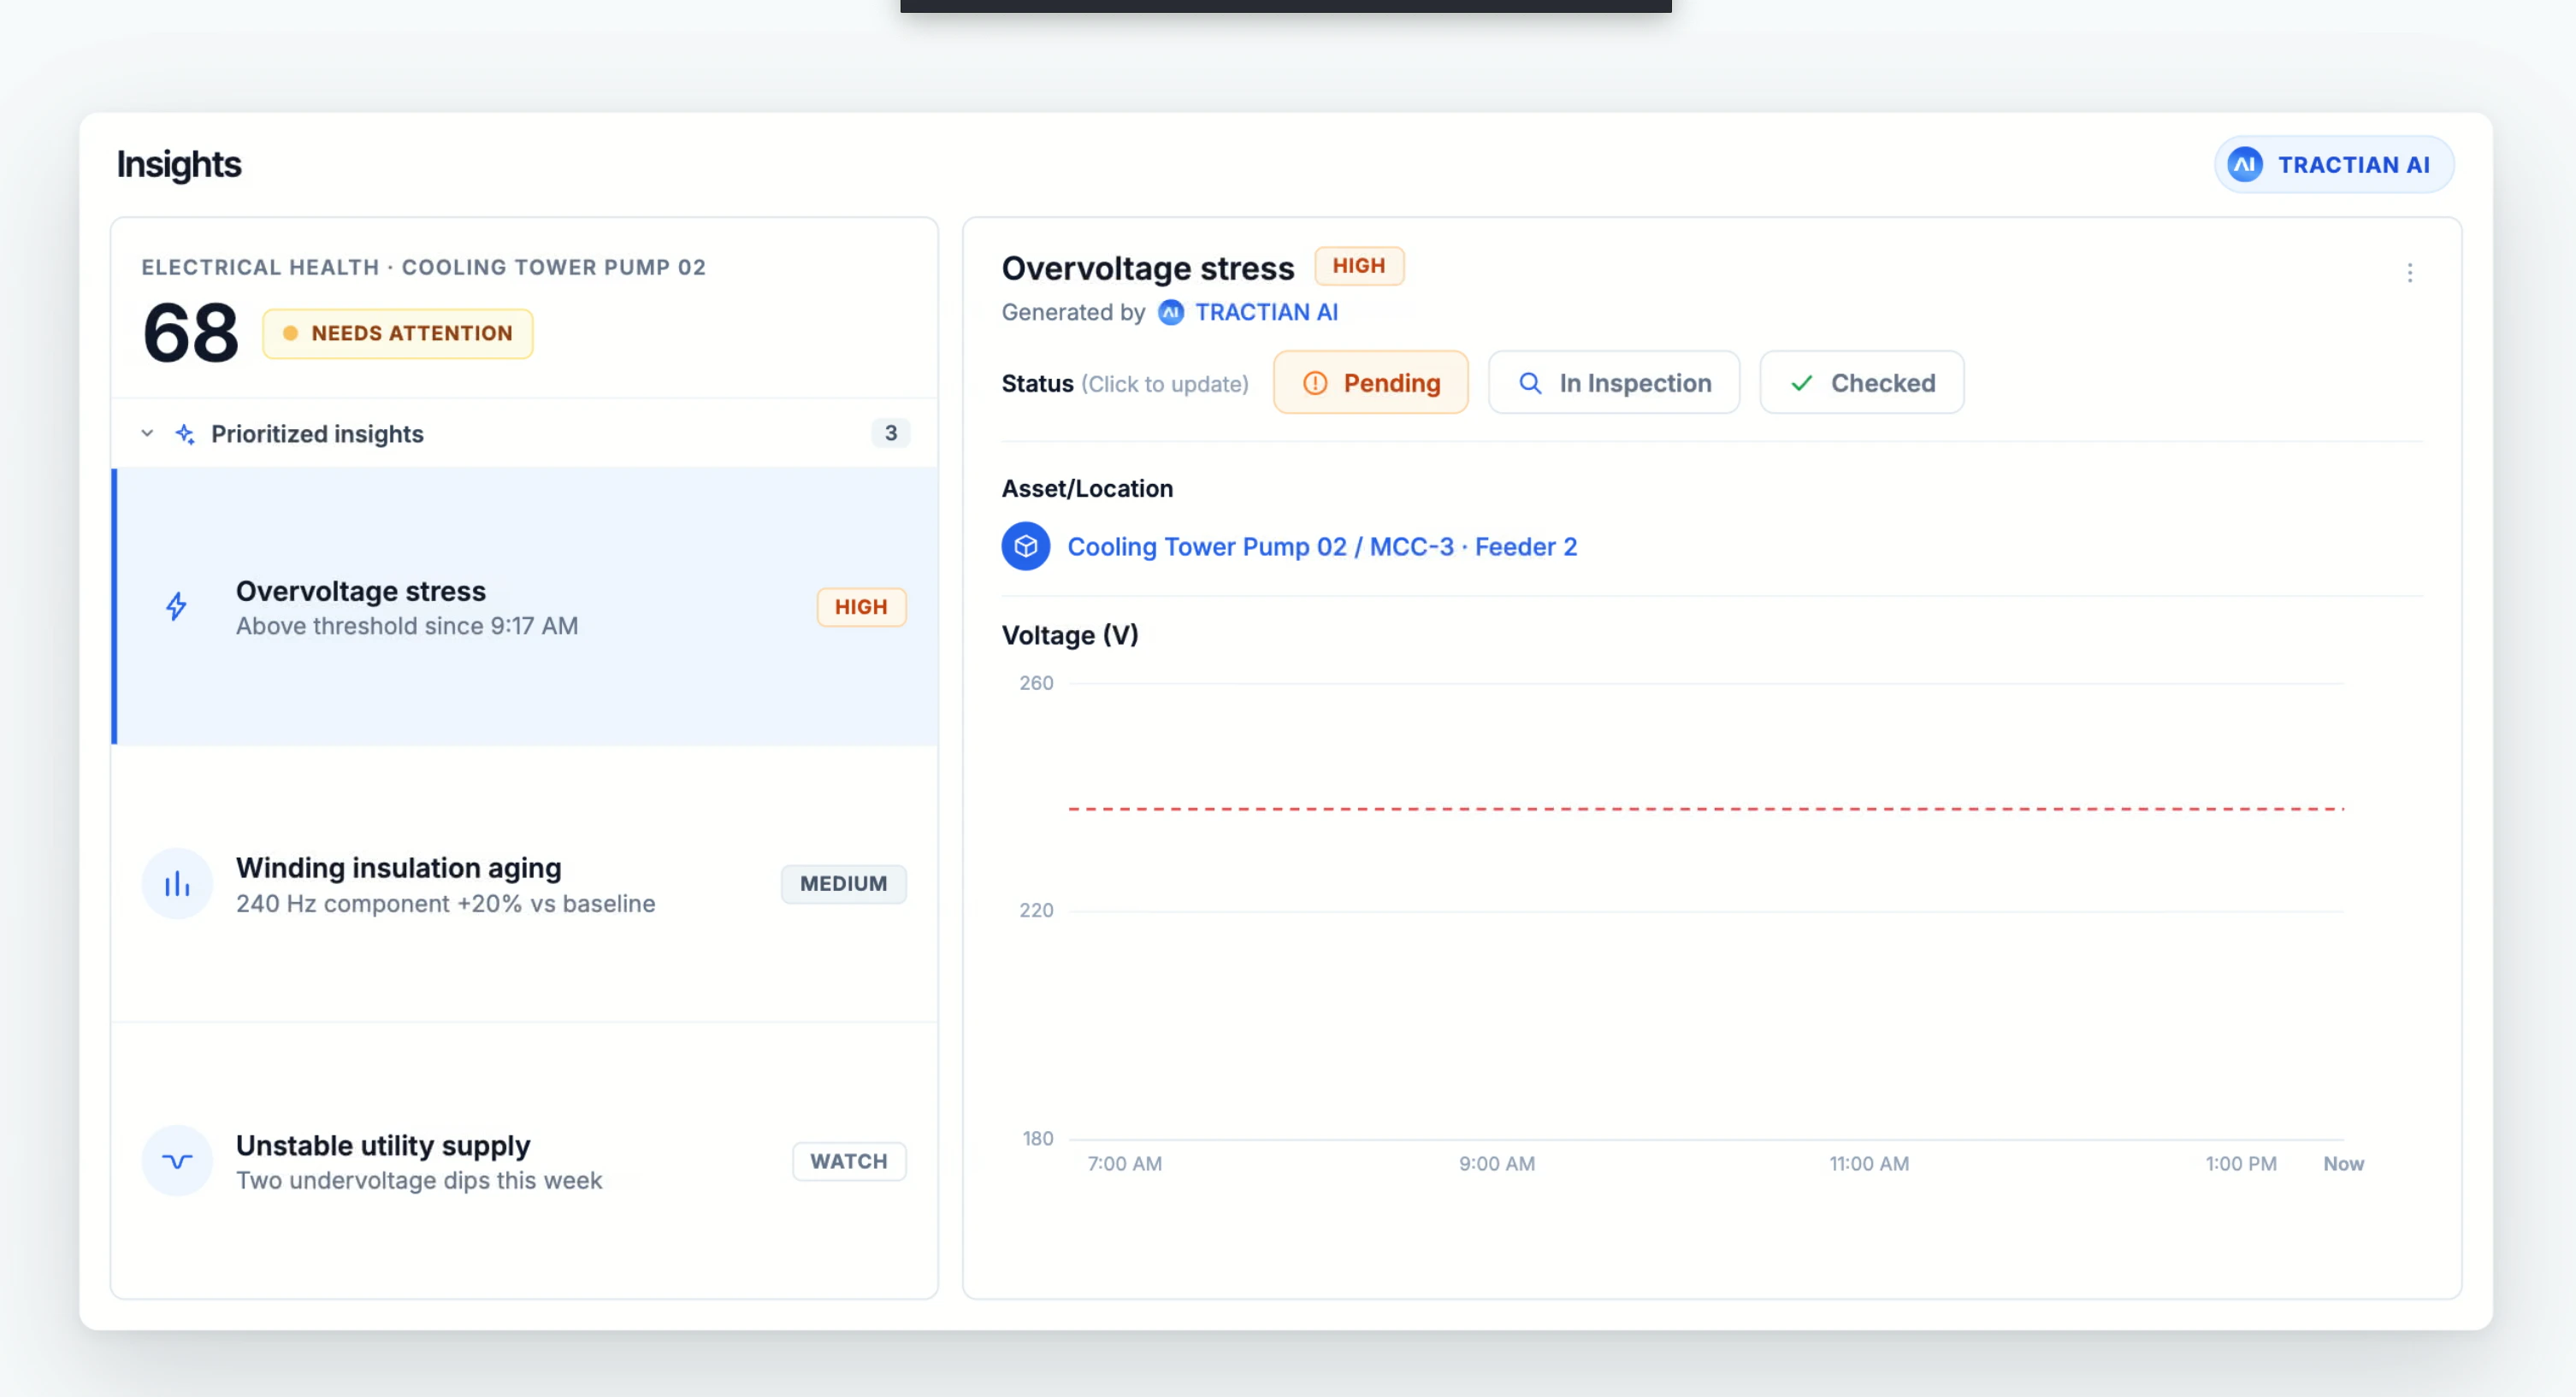
Current per phase, voltage per phase, power factor, detected faults, live for every monitored asset. Timestamped from first symptom.
Electrical Root Cause and Condition Monitoring
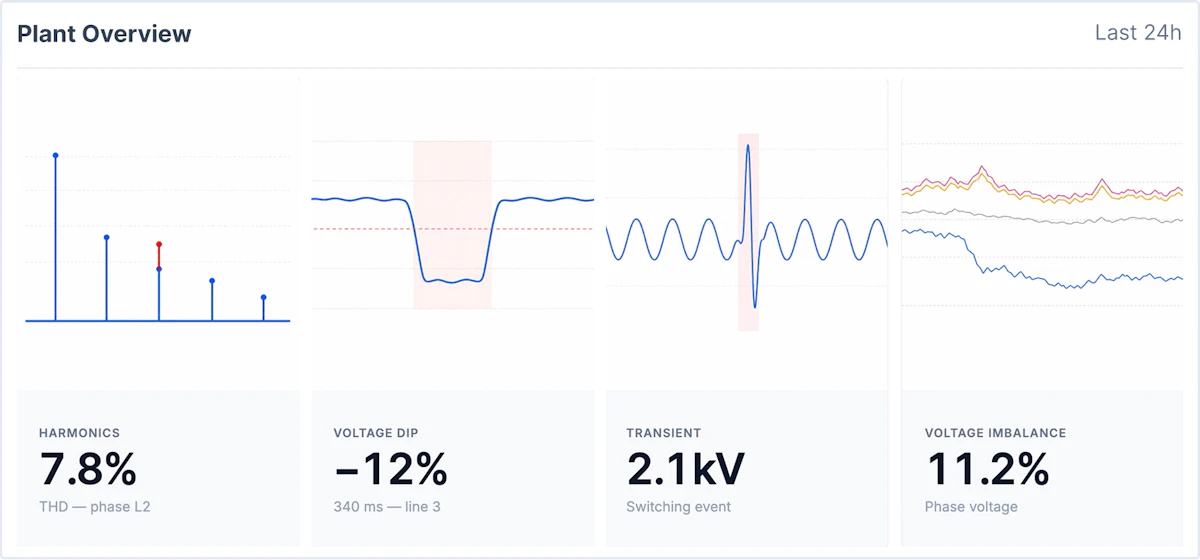
Track live electrical status across every asset: unbalance, harmonics, sags and swells, fault alerts by severity. Downtime analysis stops being a postmortem when the electrical cause was trended from its first symptom.
Electrical Fault Status
Get a unified view of the electrical health of your entire plant. Compare fault activity, power quality, and consumption by asset, shift, or line, and catch the failures developing before they cost you output.
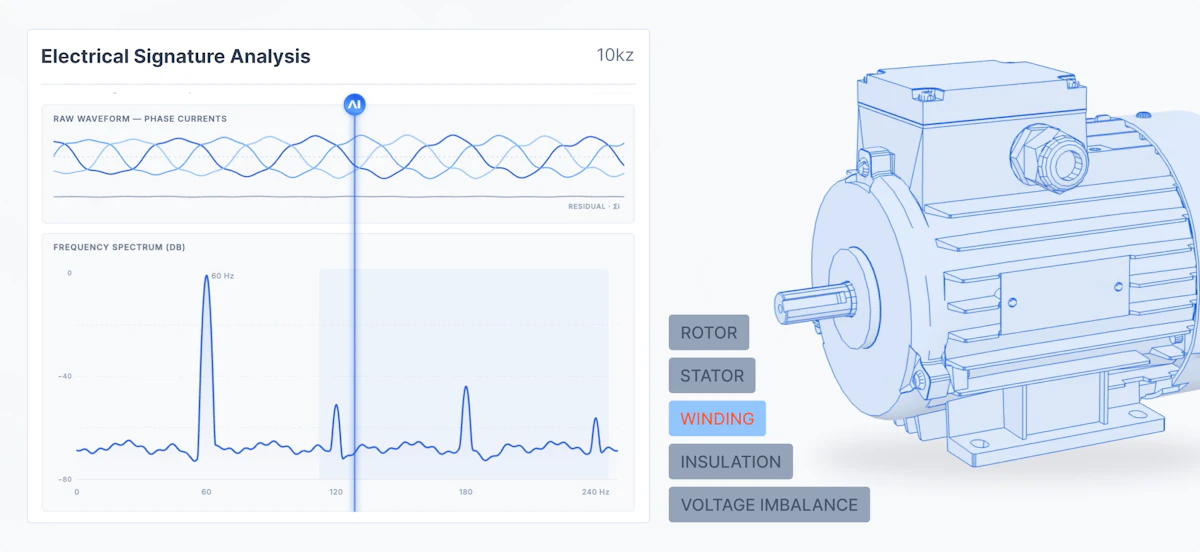
Electrical Signature Analysis
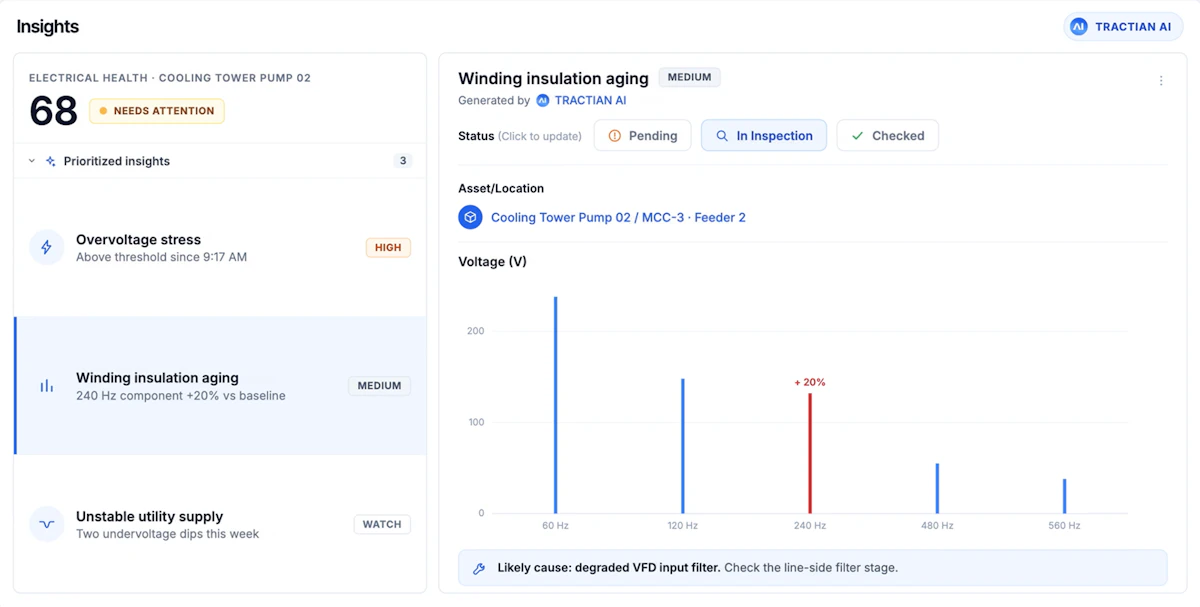
Electrical Signature Analysis reads raw waveforms and frequency spectrums to catch rotor, stator, winding, insulation, and imbalance issues while they're still small, long before they show up as a trip or a failure.
Chat with one of our experts for a quick walkthrough of the platform.
How many assets run in your operation?
By submitting the form, you are agreeing to Tractian's Privacy Policy
I agree that Tractian may contact me about their products and services.