

Key Points
- Set inspection frequency from the P-F interval: a route should run at no more than half the time a fault stays detectable before failure.
- Periodic routes still fit spared, low-consequence assets with slow wear.
- Continuous sensors fit critical assets with short or unpredictable P-F intervals, where a fault can start and finish between two visits.
Continuous vs periodic condition monitoring comes down to one number per failure mode: how long a fault stays detectable before it turns into a failure. A monthly route has time to catch slow outer-race wear on a pump bearing. The same route can walk past a lubrication fault that develops in a couple of weeks.
This guide compares the two approaches across vibration, oil analysis, infrared thermography and ultrasound, runs the math on a monthly route, and gives a criticality-based split for deciding which assets stay on routes and which get permanent sensors.
Choosing between a handheld vibration analyzer and continuous monitoring is the vibration-only version of this decision. Outsourced routes leave their own gaps between visits.
What is the difference between continuous and periodic condition monitoring?
Periodic condition monitoring takes readings on a schedule, usually a technician walking a route with a portable instrument or sample bottles. Continuous monitoring uses sensors mounted on the asset that take readings automatically and send them to software, with nobody on site.
Periodic programs are also called offline or route-based monitoring; continuous programs are called online monitoring. Both feed condition-based maintenance, where measured condition, not the calendar, triggers the work order.
The physics is the same. A spectrum from a portable collector and one from a mounted sensor can show the same bearing fault frequencies. What changes is how many spectra exist and when they were taken: a monthly route produces 12 readings per point per year, while a Tractian Smart Trac Ultra on its default setting takes a sample at 10-minute intervals.
Continuous vs periodic at a glance
Continuous monitoring trades a sensor on each monitored asset for readings minutes apart and no collection labor. Periodic routes trade low hardware cost for gaps of weeks between readings and recurring technician hours.
| Factor | Continuous monitoring | Periodic routes |
|---|---|---|
| How readings are taken | Sensors mounted on each monitored asset transmit automatically | A technician collects readings with a portable instrument or pulls samples |
| Time between readings | Minutes to hours (Tractian default: one sample each 10 minutes) | Weekly to quarterly, set by the route schedule |
| Labor per reading | No collection labor after installation | Technician time at each point, travel between assets, then analysis time |
| Hardware | One sensor per monitored asset, plus software | One portable instrument covers many assets |
| Operating conditions captured | Startups, load changes, night shifts and short production runs | Whatever state the asset is in when the technician arrives |
| What can be missed | Faults the installed sensor does not measure, such as oil contamination or a hot panel connection | Faults that start and finish between visits; points skipped when routes slip |
| Human senses on the floor | None: a sensor does not spot a leak or a missing guard | The technician sees leaks, hears new noises and notices loose guards |
| Typical fit | Critical assets whose faults develop fast or erratically | Spared or lower-consequence assets with slow, predictable wear |
How the P-F interval decides the right frequency
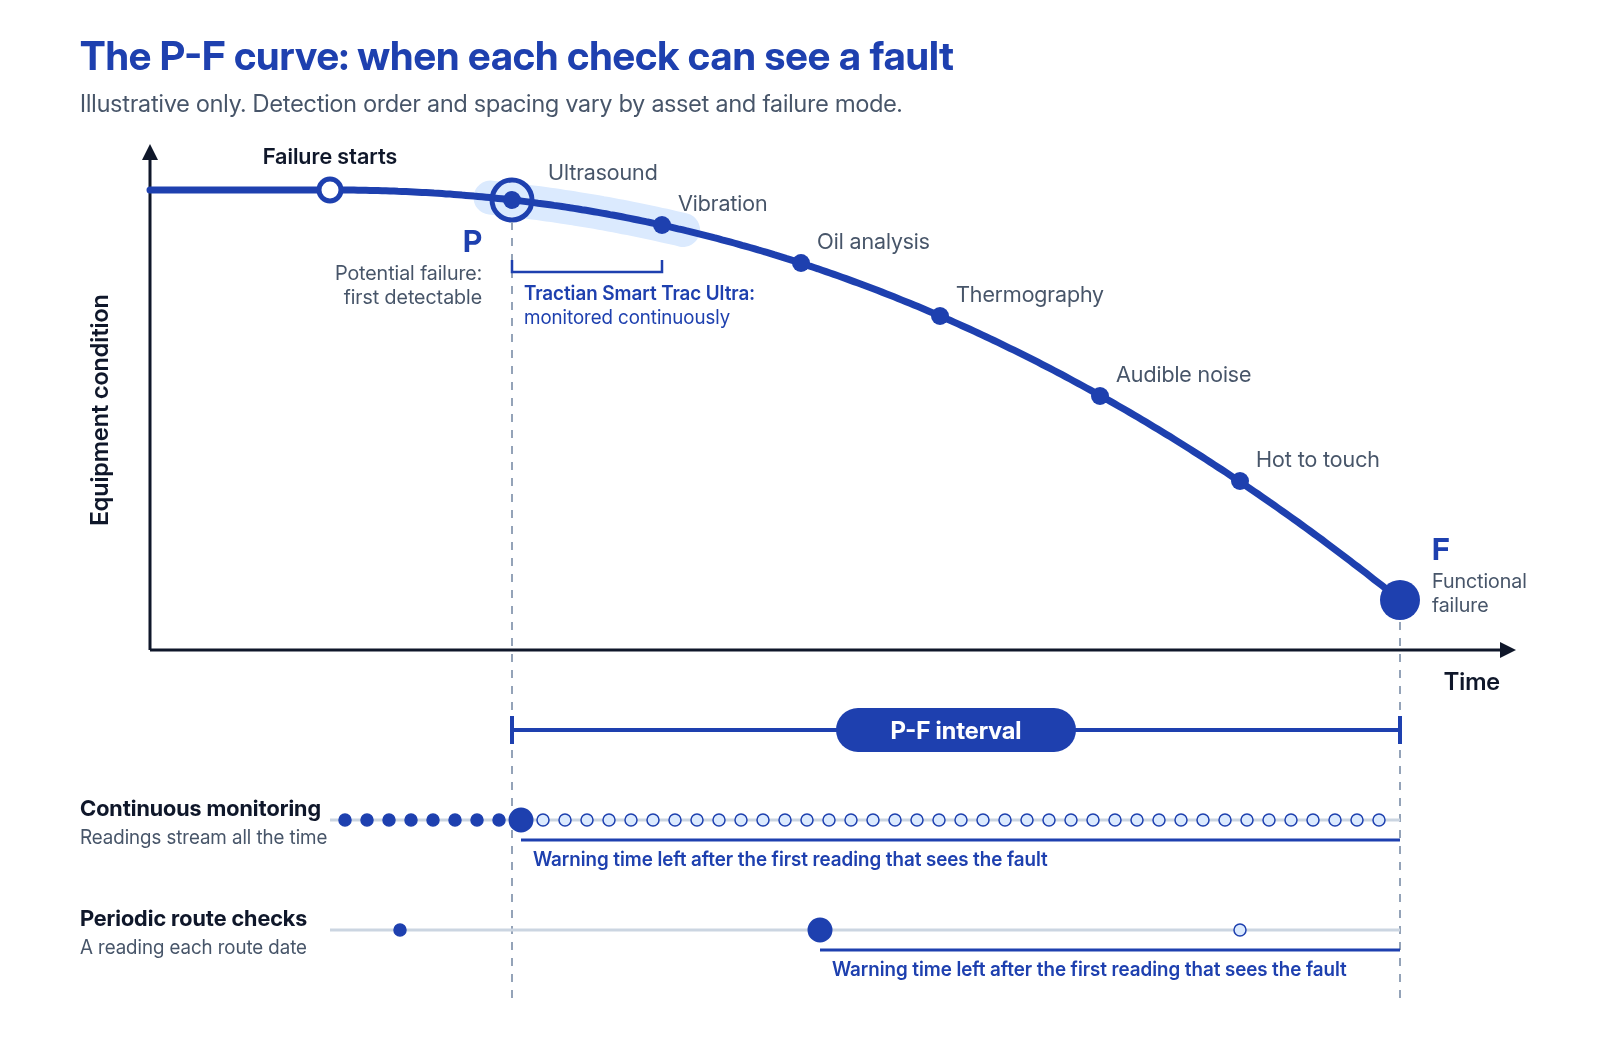
The P-F interval is the time between the point where a developing fault first becomes detectable (P) and the point of functional failure (F). The inspection interval has to be shorter than that window, or the fault can start and finish between two readings.
Each technique detects a fault at a different point on the curve. Ultrasound and vibration usually pick up a bearing problem earlier than a temperature reading does, so the same bearing has a longer P-F interval for one technique than for another.
The half-interval rule
A common reliability engineering rule of thumb sets the inspection interval at no more than half the P-F interval. That spacing puts at least two readings inside the window, which gives the analyst a trend to confirm, and leaves at least half the window to plan parts and labor.
The rule needs a P-F estimate, and P-F intervals move with load, speed and lubrication. A bearing on a steady-speed supply fan can degrade over months; the same bearing on a conveyor whose automatic greaser has failed can go much faster. Where the interval is short or uncertain, the half-interval rule asks for more route visits than most crews can walk.
Worked example: a monthly route vs a bearing fault
The inputs below are an illustrative example, not Tractian data. A motor-driven process pump sits on a 30-day vibration route, and two bearing failure modes are compared: slow outer-race wear with a 42-day P-F interval, and a lubrication fault with a 20-day P-F interval.
The model assumes the fault becomes detectable at a random point between visits and that the first reading inside the window catches it. With route interval I and P-F interval P, in days:
- When I is shorter than P, at least one reading lands inside the window. Warning left at the first reading falls between P - I and P, with an average of P - I/2.
- When I is equal to or longer than P, the chance that a reading lands inside the window is P / I. When one does, the average warning left is P/2.
| Result | 20-day P-F, continuous sensor (10-minute samples) | 42-day P-F, 30-day route | 20-day P-F, 30-day route | 20-day P-F, 10-day route |
|---|---|---|---|---|
| Chance a reading lands in the window | A new sample each 10 minutes | 100% in this model | 67% (20 / 30) | 100% in this model |
| Readings inside the window | About 2,880 (20 days x 144 per day) | 1 or 2 | 0 or 1 | 2 |
| Average warning at first detection | Set by how fast the change stands out from the baseline, not by a visit date | 27 days (42 - 30/2) | 10 days, when caught (20/2) | 15 days (20 - 10/2) |
| Worst-case warning | Depends on how clear the fault signal is | 12 days (42 - 30) | None: 1 in 3 faults reach failure between visits | 10 days (20 - 10) |
| Collection visits per asset per year | None after installation | 12 | 12 | About 36.5 |
The monthly route handles the slow wear mode with at least 12 days to plan. For the lubrication fault, one fault in three runs from detectable to failed without a reading, and the ones that are caught leave an average of 10 days.
Meeting the half-interval rule for that fault takes a 10-day route, about three times the walking on that asset. A mounted sensor takes the visit schedule out of the math; warning time then depends on how quickly the change separates from the asset's own baseline and how quickly the crew responds.
Periodic monitoring by technique
Each technique has its own route rhythm and its own case for going continuous. Vibration and ultrasound make the strongest case for permanent sensors on critical rotating equipment, while oil analysis and infrared thermography usually stay periodic.
Vibration routes
Vibration routes catch imbalance, misalignment, looseness, gear wear and bearing defects, and monthly or quarterly schedules are common. Their weak spots are faults that outrun the schedule and machines that run in batches and sit idle when the technician arrives. Continuous vibration analysis puts a mounted sensor on the asset and flags changes against that machine's own trend.
Oil analysis
Oil analysis samples go to a lab for wear metals, particle counts, water and viscosity, often monthly to quarterly on critical gearboxes and hydraulic systems. Lab results show contamination and lubricant breakdown that a vibration sensor does not measure directly. For that reason oil sampling usually stays on its schedule, even on assets that carry continuous sensors.
Infrared thermography
Infrared thermography surveys find hot electrical connections, overloaded breakers and overheating bearings or couplings. Electrical panel surveys commonly run quarterly to annually.
For motors where electrical faults matter, Energy Trac, mounted in the electrical panel, watches the circuit feeding the motor: its per-asset current, voltage and power factor readings feed alerts for rotor, stator, winding and insulation faults and for voltage imbalance. Panel surveys still cover the connections.
Ultrasound
Contact and airborne ultrasonic testing picks up friction from under- or over-greased bearings, plus compressed air leaks and electrical arcing. On a route, the ultrasound reading usually rides along with the greasing round, so it follows the greasing calendar. A Tractian Smart Trac Ultra combines vibration and continuous ultrasound in one sensor on each asset, so grease goes in when that bearing's friction rises.
| Technique | What it catches | Typical periodic interval (general practice) | Warning window (general industry ranges) | When continuous fits |
|---|---|---|---|---|
| Vibration | Imbalance, misalignment, looseness, bearing and gear defects | Monthly to quarterly routes | Weeks to months before failure | Critical rotating assets, fast or erratic faults, batch-run or variable-speed machines |
| Oil analysis | Wear metals, contamination, water, lubricant breakdown | Monthly to quarterly lab samples | Weeks to months | Usually stays periodic, run alongside sensors on the same gearbox |
| Infrared thermography | Hot connections, overloads, bearing and coupling heat | Quarterly to annual electrical surveys | Days to weeks once heat appears | Motors where electrical faults matter, through continuous current and voltage monitoring |
| Ultrasound | Lubrication friction, early bearing wear, air leaks, arcing | Tied to greasing rounds | Among the earliest signs of a lubrication fault | Bearings where the grease calendar does not match real condition |
Intervals and warning windows in this table are general industry ranges; actual values vary by asset, load and failure mode.
What each approach costs
Periodic routes cost technician hours on each visit and look cheap per asset. Continuous monitoring costs hardware and software up front and cuts collection labor, so a fair comparison has to include what a missed failure costs.
Route labor
Route hours per year = assets on the route x minutes per asset (including walking) x visits per year / 60. As an illustrative example, 80 assets at 8 minutes each on a monthly route take 128 hours a year. Tightening that route to a 10-day cycle for the faster fault modes takes about 389 hours, before analysis time and the lag between reading and work order.
Sensors and software
Hardware cost follows the length of the critical list, because each asset on it carries its own Smart Trac Ultra; reading frequency adds nothing to that bill. Battery life is up to 5 years, which keeps sensor upkeep off the weekly schedule.
Tractian pricing is built around the machines on that critical list rather than a sensor count: a specialist looks at how each one fails and which signals catch it earliest, then prices a coverage plan around that risk as a custom quote.
Missed failures
A failure between visits adds lost production, emergency labor, expedited parts and collateral damage to the repair. At Tate & Lyle, a failure on a fermenter agitator could shut down production for 3 to 4 days and required cranes and manual gearbox replacement. To size this for a specific plant, enter its downtime cost per hour and asset count in the ROI calculator for online condition monitoring.
When each fits: a criticality-based split
Sort assets by two questions: what a failure costs, and how fast it develops. Assets high on both get continuous monitoring, assets low on both stay on routes, and the middle group gets a decision per failure mode. A formal criticality analysis gives the first score; failure history gives the second.
Move to continuous monitoring
- No installed spare, and a failure stops a line: main drive motors, process pumps, agitators, induced draft fans.
- Short or unpredictable P-F intervals, such as lubrication faults or bearings under shock loads.
- Hard or unsafe to reach on foot: elevated conveyors, enclosed machinery, hazardous locations.
- Batch-run or variable-speed machines that may be stopped or at the wrong speed when a route reaches them.
- Repeat failures where the team needs the full trend to find the root cause.
Keep on periodic routes
- Spared pumps and fans where a standby unit carries the load during the repair.
- Slow wear modes that a monthly or quarterly route catches with weeks to spare.
- Low-consequence equipment where run-to-failure or a calendar PM costs less than monitoring.
- Checks that need human eyes and ears: leaks, belt condition, guards, housekeeping.
Run both on the same asset
A critical gearbox can carry a vibration and ultrasound sensor and stay on the quarterly oil sampling list, since each method sees different failure modes. To turn the split into a rollout plan with phases and owners, follow the steps to build a condition monitoring program.
How Tractian continuous monitoring covers critical assets
Tractian puts continuous coverage on the assets the criticality split flags, pairing wireless sensors with AI software that names the fault, points to its likely cause and lays out the repair. Readings stream in real time, so the warning window is no longer set by the next route date.
One Smart Trac Ultra goes on each asset and measures vibration, ultrasound, temperature and RPM. Auto Diagnosis reads those signals and names the failure mode behind a change (a worn bearing, a misaligned coupling, an unbalanced rotor), and alerts are sorted by how severe the fault is and how critical the machine is. Expert-vetted human review from Tractian specialists is available for alerts that need a second look.
Where an electrical fault is the larger concern, Energy Trac adds the electrical side from the motor's panel. That pairing of mechanical and electrical data for one motor forms Tractian multimodal condition monitoring. Janus, Tractian’s industrial AI, was trained on proprietary data from real machines and weighs both signal types with operational and historical context to give one view of each motor’s health.
- Fast install: a technician glues or screws the sensor base to the asset in minutes, and readings reach the platform over 4G/LTE rather than plant Wi-Fi or new cabling.
- Hazardous areas: Smart Trac Ultra is Class I Div 1 ATEX/IECEx/NFPA compliant. Its IP69K rating covers washdown zones.
- Integrations: Tractian focuses on condition monitoring and plugs into the CMMS a plant already runs, including MaintainX, Fiix, UpKeep and Limble, plus ERPs such as SAP and Oracle NetSuite, through Tractian integrations.
Results from plants that moved off routes
Cadillac Casting, a 280,000 square foot foundry in Michigan with roughly 500 pieces of equipment, already ran sensors, manual vibration routes and outside analysts, and failures still got missed. Shortly after Tractian went in, the platform flagged bearing wear and rapidly declining lubrication on a 200 HP motor. The maintenance supervisor planned the motor change for the weekend, and the teardown showed a locked bearing rubbing on the shaft, the fault the data had pointed to.
Tate & Lyle ran monthly PMs at its San Diego facility and still had unexpected breakdowns on critical equipment. Within months of monitoring 280+ critical assets with Tractian, the team recorded $446.9K in total cost savings, including $380K in production uptime, and 84 hours of downtime avoided, including a major unbalance incident on a dryer bearing.
Continuous data also feeds planning: trends on each monitored asset help schedule repairs into planned windows. Learn more about Tractian predictive maintenance.
Frequently Asked Questions
What is the difference between online and offline condition monitoring?
Online condition monitoring is another name for continuous monitoring: sensors stay mounted on the asset and send readings automatically. Offline monitoring is periodic: a technician collects readings or oil samples on a route, and the data is analyzed afterward. Most plants run a mix, with online sensors on critical machines and offline routes on the rest of the fleet.
How often should a vibration route run?
Keep the gap between visits to half the P-F interval or less for the fastest failure mode the route is meant to catch. Monthly routes are a common default for general rotating equipment, and quarterly routes are common for low-criticality machines. When the half-interval rule calls for weekly or biweekly visits, a permanent sensor on that asset usually costs less than the extra walking.
Does continuous monitoring replace oil analysis and thermography?
No. Vibration and ultrasound sensors measure mechanical condition; they do not read wear metals in a gearbox oil sample or find a hot lug in an electrical panel. Plants commonly keep oil sampling and infrared surveys on their schedules and move the vibration and lubrication checks on critical assets to sensors.
How do you estimate the P-F interval for an asset?
Start from the asset's failure history: how far ahead of past failures the first sign appeared in route data, oil reports or operator notes. OEM guidance and reliability references give general ranges by technique and failure mode. With no history, pick a conservative estimate and shorten it whenever a fault is found later than planned.
Which assets should move to continuous monitoring first?
Start with assets that have no installed spare, stop production when they fail, and have short or unpredictable failure development. Keeping the first list short lets the team check alerts against teardown findings before adding more machines. Spared, slow-wearing equipment can wait for a later phase or stay on routes.
Decide Which Assets Get Continuous Coverage
Start with the ten machines whose failure would hurt most and the failure modes behind each one. Tractian specialists can map which of them need permanent sensors, which can stay on routes, and what that coverage would cost. Explore Tractian condition monitoring.