This is a technical article intended for general use, regardless of whether you work with maintenance or not. It is intended to provide a practical understanding of the analysis of vibration signals in machines and their purposes.
To better understand what a vibration signal looks like, imagine shaking a rope that is attached to a wall.
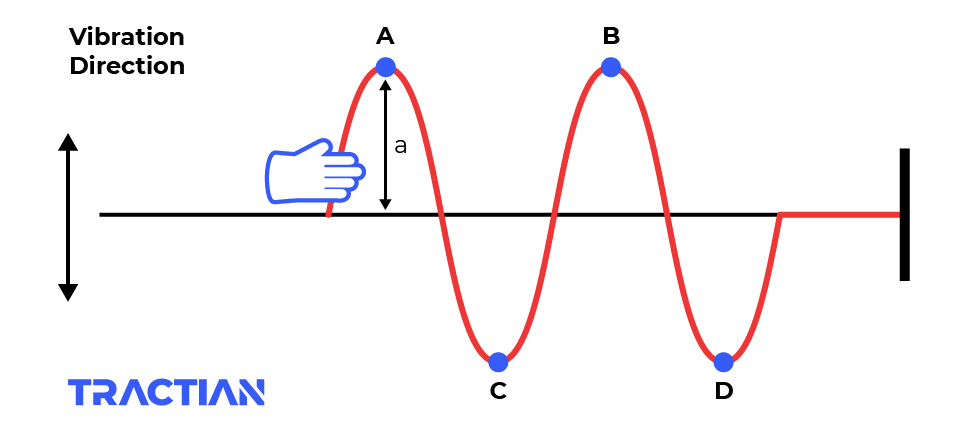
The oscillatory motion performed by points A, B, C, and D is the result of the oscillation generated by your hand and can be seen as a vibration movement itself.
If we consider only what happens at point A in the rope and plot the position of point A vs. Time on the graph, we obtain the same formation that resulted from your shaking of the rope. This is exactly what one of the components of a vibration signal looks like:
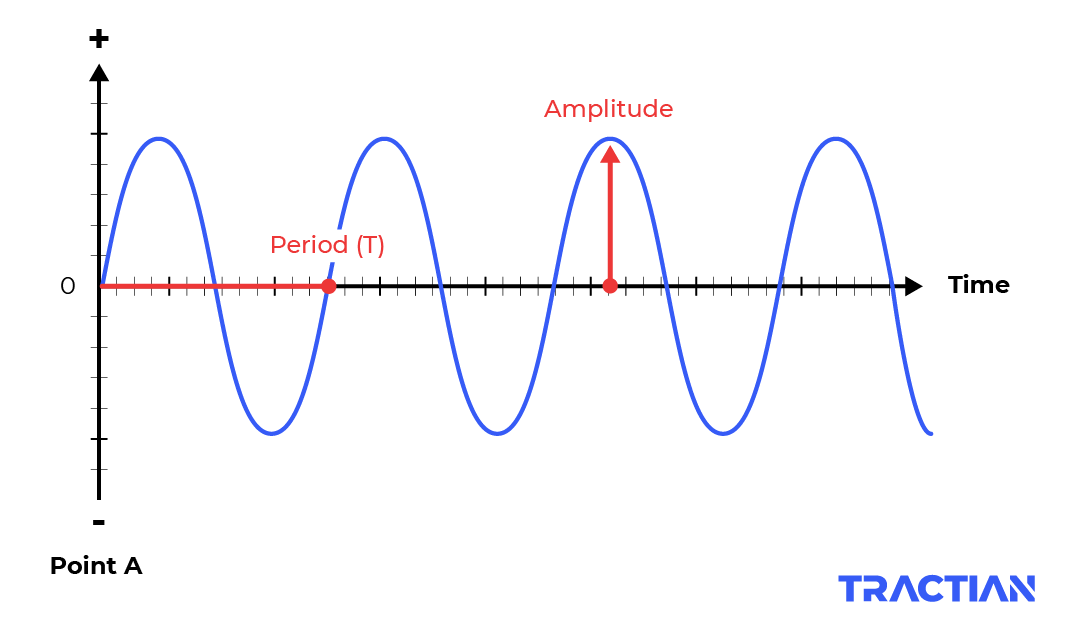
We should point out that:
- The wave period is the time it takes for point A of the rope to restart a cycle
- Amplitude is the maximum distance point A reaches in relation to the position it would be if the rope had been stretched
- Frequency is the number of times a cycle is completed in one second. If period T in the first rope is 2 seconds, our frequency would be the other way round, that is 0,5 Hertz (half a cycle per second)
Do you remember the wall you attached the first rope to? Now imagine 5 friends of yours doing the same thing on the same wall, shaking their ropes with different frequencies. We now have 6 different signals from ‘A’ points deriving from the different ropes, as in the picture below.
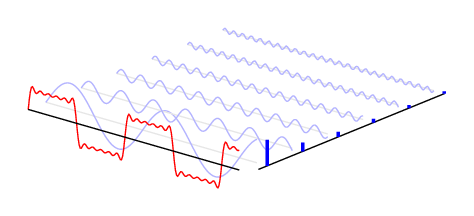
But what about the wall that is holding all these ropes shaking together?
The wall will receive a total vibration signal that is transmitted by the ropes (red line).
Making an analogy with machines:
The wall would be the ideal location in the machine to capture the total vibration signal.
The red line would be the overall vibration of the machine, whereas the ropes would be the factors that influence the overall machine vibration.
For instance, these factors might include,:
- Wear and tear/deterioration
- Bearing failures
- Mechanic looseness
- Misalignment
- Resonance
- Lubrication
- Eccentricity
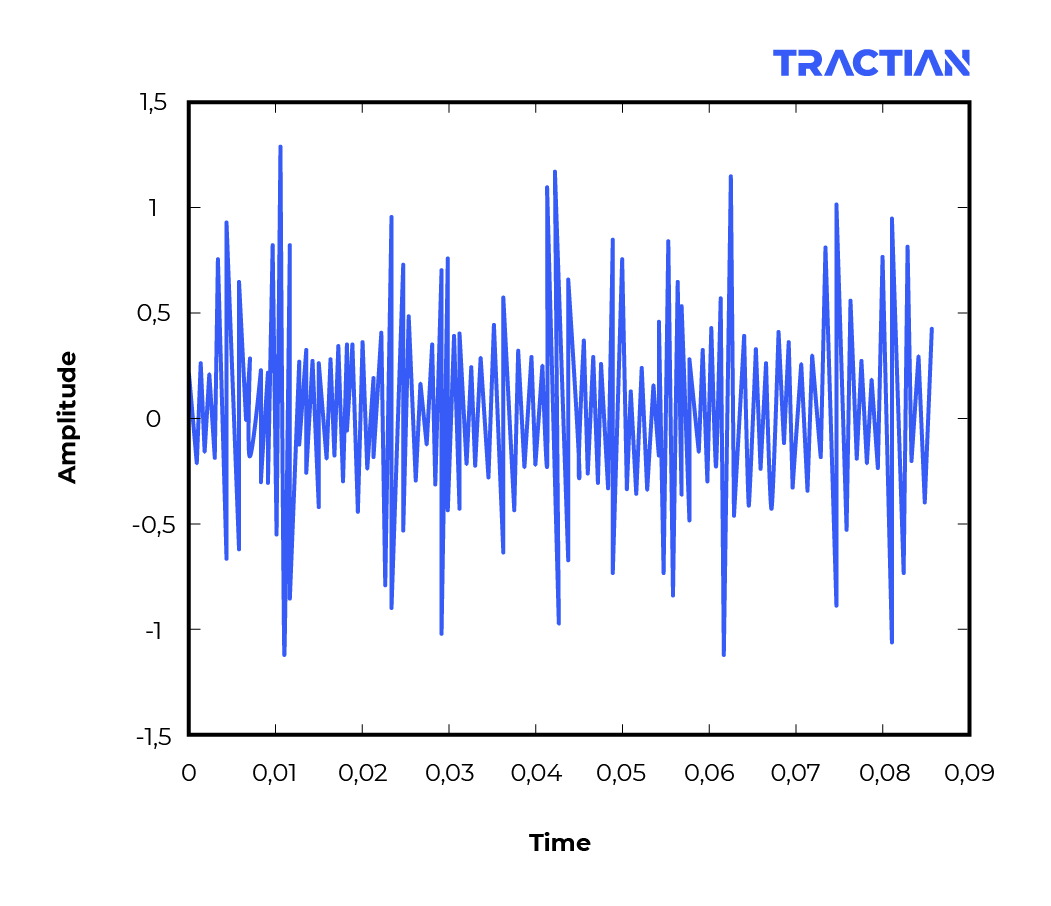
In the example of the rope, we can visualize exactly what the generated signal looks like coming from each of our friends. However, it doesn’t really happen this way in real life.
The presence of noise can interfere with the visualization process, and the sensor only receives the overall result of various factors. To continue with the analogy, it’s as if the sensor is observing the shaking as a whole without being able to discern the specific effect of each rope shaking individually.
In order to interpret this signal and know how many factors are influencing this vibration, the Fourier Transform is commonly used. We then substitute the time axis for the frequency axis, facilitating the visualization of the signal composition.
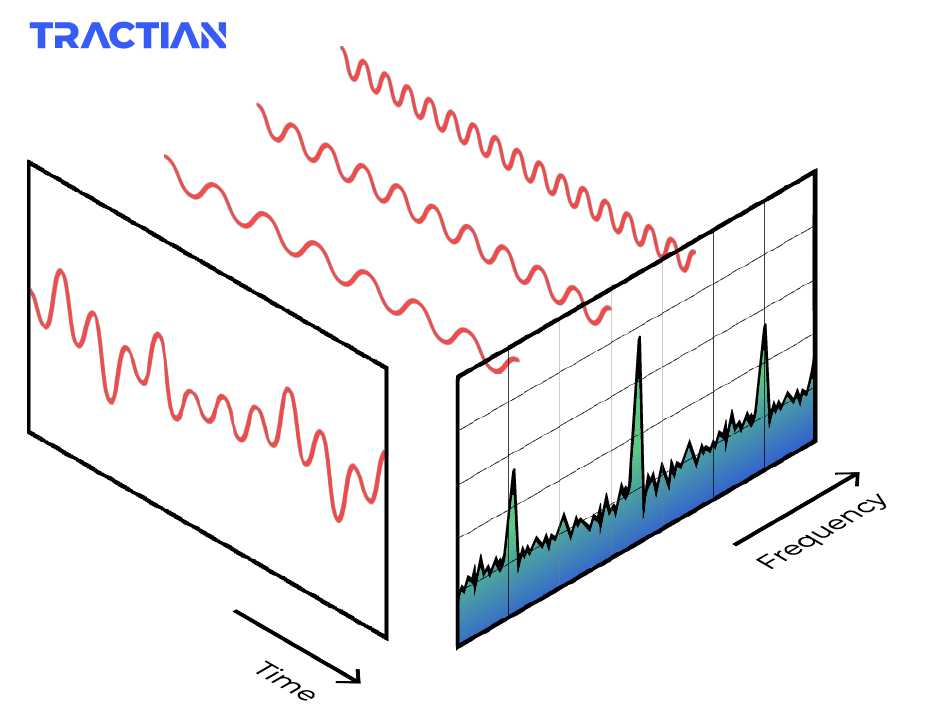
When the Fourier Transform is used, we then have the Spectral Analysis.
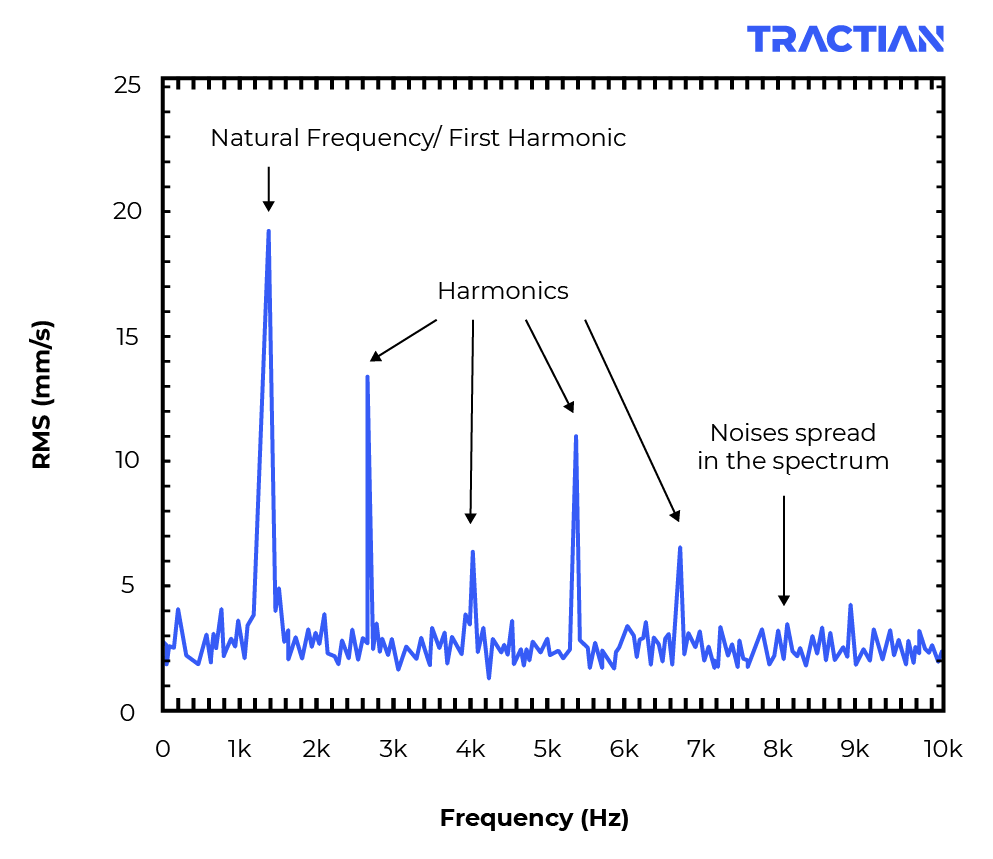
Each type of machine has an original spectral signature.
From this signature, we can identify vibration features in each individual component to monitor its condition and diagnose the factors listed here before, like wear and tear or misalignment for instance.
The analysis of each machine’s spectral signature is already very commonly used, but it has to be done periodically by technicians with expertise in vibration analysis and maintenance.
With the analysis performed to the naked eye and based on the technician’s observations about the right operation of the machine, a large part of the history and knowledge of the machine’s vibration standards is lost along the way. That could get in the way of an accurate diagnosis of possible problems.
For that reason, today at TRACTIAN we utilize Machine Learning to point out the deterioration of the machine’s spectral signature and generate very accurate insights about the causes of the problem.
That way we can save all the operation history, take preventive decisions and prevent larger damages in machines that are bound to fail and interrupt production.
How is the data science produced to identify those changes?
In my next article, I’ll explain how this automatic analysis works. Follow our page or contact us to learn more.