
Most industrial operations managers and plant directors will tell you how fast your inventory turns into finished products and how long parts sit on your shelves to tell an important story. And that story is more significant than you might think.
To tell this story, maintenance teams, managers, and directors use a financial accounting formula known as Days Sales of Inventory (DSI). But as we’ve alluded to, its impact goes beyond the books.
DSI is a direct window into your supply chain’s efficiency and how much working capital is tied up in stock instead of being used to drive production forward.
At a strategic reporting level, DSI is a tool that links inventory health to asset uptime, purchasing strategies, and even how prepared your operation is to handle unexpected breakdowns.
A high DSI might indicate that valuable capital is tied up in slow-moving parts, while a low DSI suggests stockouts that could lead to downtime when critical components are needed.
In this article, we’ll explain exactly what DSI is, how to calculate it, and why it’s essential for keeping equipment running with an agile inventory.
Whether you’re fine-tuning your MRO stock strategy or trying to free up cash flow without sacrificing reliability, mastering DSI provides you with the control and visibility modern maintenance teams require.
What Is Days Sales of Inventory (DSI)?
DSI measures how long, on average, a company holds inventory before it’s sold or used. In essence, it tracks the average time parts, materials, or products sit in storage before they move through production or reach the end customer.
In maintenance-heavy industries, spare parts inventories are just as critical as production materials. Therefore, DSI monitors your operation’s efficiency by keeping a virtual finger on the pulse of all inventory flows.
DSI’s ability to reflect how well your team balances stock availability against capital efficiency demonstrates why it’s so much more than an accounting formula.
For example, a higher DSI could indicate slow inventory turnover, possibly signaling overstocked shelves, outdated materials, or purchasing strategies that are out of sync with actual usage.
However, a lower DSI may suggest a streamlined inventory process. Though, you should keep asking questions to fully understand why it’s low. Raise questions like:
- Are you cutting it too close with stock levels?
- Could a single supply chain disruption leave you exposed to downtime?
And, for instance, if your answer is “yes,” then some fine-tuning is still required.
Why Is DSI Important to Track?
We’ve already shown that DSI is a strategic benchmark that reveals how well your operation balances availability, responsiveness, and financial efficiency. But there’s more.
One of the most valuable aspects of DSI is its role in risk forecasting. By monitoring how long parts and materials remain in inventory, you get early visibility into potential overstock, aging inventory, and even issues related to supplier reliability.
If lead times increase and DSI rises, it could signal shifts in supply chain performance that threaten your ability to respond quickly to critical repairs.
DSI also provides a standardized metric for comparing your operation to industry norms. Every sector, from food processing to heavy manufacturing, has its own typical DSI range.
Falling too far outside that range often means you’re either tying up too much cash in excess inventory or running too lean, exposing your plant to unplanned downtime risk.
Tracking DSI over time offers data-driven proof of how inventory management decisions impact working capital and plant reliability.
DSI vs. Inventory Turnover
Days Sales of Inventory and inventory turnover are two sides of the same coin. Both measure how efficiently a company manages its inventory but from different angles.
Understanding how they complement each other helps maintenance managers and plant directors diagnose gaps in their inventory strategies with precision.
Inventory Turnover
Inventory turnover tracks how many times your inventory cycles through the operation in a given period, with a typical period being a year. A higher turnover rate usually signals efficient purchasing and consumption patterns, where stock flows in and out smoothly without excessive buildup.
DSI
DSI, on the other hand, looks at how long inventory sits before it moves. It translates turnover speed into a more tangible, time-based metric that answers the question: On average, how many days does it take to sell or consume the inventory you have on hand?
Why Both Matter in Maintenance Operations
For maintenance teams, neither metric works in isolation. High inventory turnover might seem positive, but if DSI shows that parts leave shelves faster than suppliers can replenish them, you could be racing toward stockouts and unplanned downtime.
Conversely, a low turnover rate paired with a rising DSI often exposes slow-moving or obsolete parts clogging up valuable storage space and tying up working capital.
The sweet spot? A balanced relationship between the two metrics, where inventory turns over steadily while DSI stays within an optimal range. However, ranges differ depending on your business sector.
Regardless, balance ensures you’re lean enough to avoid cash flow problems, but stocked well enough to keep critical assets online-even when unexpected failures hit.
Together, DSI and inventory turnover provide a comprehensive assessment of how effectively your inventory strategy supports operational readiness, cash flow, and long-term reliability objectives. Next, we’ll explore how they can work in conjunction.
Utilizing DSI and Inventory Turnover Together
Monitoring DSI and inventory turnover alongside each other provides maintenance and operations teams with a comprehensive, real-time view of inventory performance.
Here’s how they work in tandem:
- DSI identifies bottlenecks in inventory velocity, highlighting parts that sit too long, tie up capital, or risk obsolescence.
- Inventory turnover reveals whether parts flow efficiently through the maintenance lifecycle, helping pinpoint whether stock moves too slowly or uncomfortably fast.
Combined, they form a dynamic feedback loop.
A sharp drop in DSI may look like a success, but if inventory turnover spikes at the same time, it could indicate that parts are flying off the shelves faster than suppliers can replenish them. Such a case is a clear warning critical spares could soon become unavailable when you need them.
An increase in DSI alongside declining turnover may indicate that you are holding excess inventory, particularly of low-priority or slow-moving items. This situation inflates storage costs and ties up working capital that could be more effectively used for predictive maintenance or process improvements.
For reliability teams, using DSI and inventory turnover together turns gut-feel inventory decisions into data-driven strategies.
Based on hard numbers tied directly to how parts flow through your operation, you can adjust reorder points, fine-tune safety stock levels, and improve procurement timing.
Formula for Days Sales Inventory (DSI)
When it comes to measuring how efficiently your inventory is moving, the formula for DSI is both straightforward and powerful.
It captures how long, on average, your inventory sits before being sold or used. The result directly reflects how well your supply chain, procurement process, and maintenance planning are aligned with actual demand.
The formula itself pulls from your inventory balance and your cost of goods sold (COGS), making it adaptable across any time period-monthly, quarterly, or annually-depending on how closely you want to track performance.
DSI = (Inventory ÷ Cost of Sales) × Number of Days in the Period
This formula breaks down into three core components:
- Inventory - The total value of inventory on hand at the end of the period. In an industrial setting, this could include everything from critical spares to consumables, covering your full maintenance stock.
- Cost of Sales (COGS) - This represents the direct costs of producing your goods, including materials, labor, and overhead linked directly to production. For maintenance-heavy industries, it’s common to track this in relation to equipment uptime and production output.
- Number of Days - Whether you’re calculating for a month (30 days), a quarter (90 days), or a full year (365 days), this figure sets the timeframe for your DSI measurement.
Why This Formula Works for Industrial Maintenance
For maintenance and reliability teams, utilizing this formula helps quantify the amount of working capital tied up in parts inventory. More importantly, it highlights whether that inventory is moving in sync with your actual maintenance and production needs.
The goal isn’t just lowering DSI for its own sake. Rather, it focuses on maintaining a healthy balance between having the right parts on hand and avoiding excessive buildup. As we’ve noted, buildup locks up cash flow and storage space.
How Do You Interpret Days Sales of Inventory?
Interpreting DSI is about understanding how that number fits into the broader context of your plant’s operational rhythm. It’s less about whether that number is good or bad than the efficiency of your maintenance strategy and the reliability of your supply chain.
Though a higher DSI typically means inventory is turning over more slowly, that’s not automatically negative.
In industries where long lead times are the norm or critical spare parts must be stocked well in advance, a slightly elevated DSI could reflect a proactive risk management approach.
The key is knowing whether that inventory is strategically positioned or simply piling up due to outdated purchasing practices.
Likewise, a lower DSI signals faster inventory turnover, often suggesting leaner, more efficient inventory management. Yet, it can also be a warning sign if turnover is outpacing supply, which exposes certain operations to stockouts.
What Does a Low Days Sales of Inventory Indicate?
A low DSI typically means inventory is turning over quickly, with parts moving off the shelves faster than usual. But in asset-intensive industries, low DSI isn’t always a win.
Below are some potential interpretations of low DSI:
- Efficient procurement and planning - Stock levels are well-matched to actual maintenance needs, with just-in-time delivery strategies working as planned.
- Increased equipment reliability - Fewer breakdowns mean fewer spare parts consumed, allowing inventory to flow more predictably.
- Risk of stockouts - If low DSI results from cutting inventory too aggressively, critical spares may not be available when needed, which drives up emergency order costs and increases downtime risk.
- Misaligned purchasing - Procurement teams might be reducing order sizes to improve cash flow, but without input from maintenance teams, that can leave the operation exposed.
In short, low DSI is only positive if it’s intentional and supported by reliable demand forecasting, strong supplier relationships, and resilient maintenance practices. Without those safeguards, low DSI can shift from a sign of efficiency to a warning signal.
What Is a Good Days Sales of Inventory Number?
As with low DSI, there’s no universal “good” DSI number either. Every facility has its own operational profile, supply chain constraints, and reliability goals.
What works for a pharmaceutical plant with highly regulated stock requirements will look completely different from a paper mill managing large, slow-moving spare parts.
That said, good DSI is always the one that aligns with your plant’s unique mix of:
- Lead times from your key suppliers
- Criticality of your assets and parts
- Planned maintenance schedules and historical consumption data
- Tolerance for unplanned downtime and emergency procurement costs
The best benchmark for a “good” DSI is your own performance over time, combined with industry-specific standards.
For example, in continuous process industries (like chemicals or food processing), companies tend to favor lower DSI to avoid cash being trapped in excess stock. In industries with long lead times or specialized equipment, a slightly higher DSI is normal to ensure critical parts are available when needed.
Benefits of Days Sales of Inventory (DSI)
Tracking Days Sales of Inventory gives maintenance leaders and plant directors a clear, measurable way to assess how well inventory strategies align with asset reliability goals and broader operational performance.
Operational Efficiency
As we’ve pointed out, every part sitting in inventory is a reflection of how well maintenance, procurement, and reliability teams are coordinating asset needs with supply chain realities.
Monitoring DSI over time helps pinpoint exactly where process misalignments can present themselves:
- Long lead times pushing stock levels higher than necessary.
- Disconnects between planned maintenance schedules and actual parts consumption.
- Over-purchasing of non-critical items while critical spares run too lean.
- Mismatched stocking strategies for fast-moving vs. slow-moving components.
DSI trends also provide data-driven input for inventory segmentation strategies, helping teams categorize parts by criticality and how quickly they turn relative to asset-specific risk profiles.
High-turnover, high-critical parts demand tighter cycle counts and closer forecasting, while slower-moving consumables can follow more cost-efficient bulk purchasing cycles.
In maintenance-heavy operations, DSI is a key tool to diagnose operational processes.
It reflects how smoothly parts move from procurement to point-of-use, exposing bottlenecks where inventory gets held up due to poor data, inaccurate demand planning, or breakdowns in communication between operations and supply chain teams.
Working Capital Management
While working capital decisions are often led by finance teams, maintenance and reliability managers directly control one of the largest working capital drivers in any asset-intensive business - spare parts inventory.
Monitoring DSI ensures that inventory decisions remain grounded in actual asset needs, rather than procurement habits or reactionary stocking decisions.
High DSI, especially for low-usage or obsolete parts, signals that maintenance budgets are being absorbed by inventory that contributes nothing to improving asset reliability or reducing downtime risk.
That’s capital that could - and should - be redirected into predictive technologies, reliability-centered maintenance initiatives, or equipment upgrades.
On the flip side, aggressively slashing inventory to free up working capital can create hidden costs like expedited shipping, unplanned emergency orders, or stockout-caused downtime.
DSI helps balance working capital targets with operational reality, ensuring that cash flow goals never come at the expense of equipment availability.
By linking DSI trends to asset performance, lead time data, and failure history, maintenance leaders can present a data-backed case for why certain parts deserve higher stocking thresholds in order to protect the business’s cash position by avoiding costly reactive purchases down the line.
How Can Inventory Optimization Improve DSI?
Inventory optimization and DSI are directly linked because DSI offers insight into how well your stocking strategies align with actual equipment needs.
When spare parts management moves from gut-feel ordering to data-driven inventory optimization, the result is tighter alignment between what’s in stock, what’s actively used, and what’s realistically needed to support asset reliability.
That’s when DSI trends toward its optimal range, where stock levels protect uptime without locking unnecessary capital into slow-moving parts.
Inventory optimization improves DSI by replacing reactive stocking with proactive, condition-based replenishment. Instead of maintaining static safety stock levels, optimized systems tie reorder points to:
- Real consumption patterns based on work order history.
- Criticality ratings tied to asset risk profiles.
- Lead time variability-accounting for both supplier reliability and global supply chain disruptions.
- Failure mode data-ensuring parts for known failure points stay available without overstocking everything else.
Dynamic inventory optimization also breaks the ‘just-in-case’ mindset that bloats MRO inventories.
When parts lists and stocking rules are built around asset condition data, historical failure rates, and predictive maintenance insights, you can hold fewer parts but the right parts.
The biggest optimization gains typically come from accurate part classification and applying different stocking strategies to each tier.
Critical spares with long lead times justify higher stocking thresholds, while non-critical consumables can follow bulk ordering schedules with less frequent replenishment.
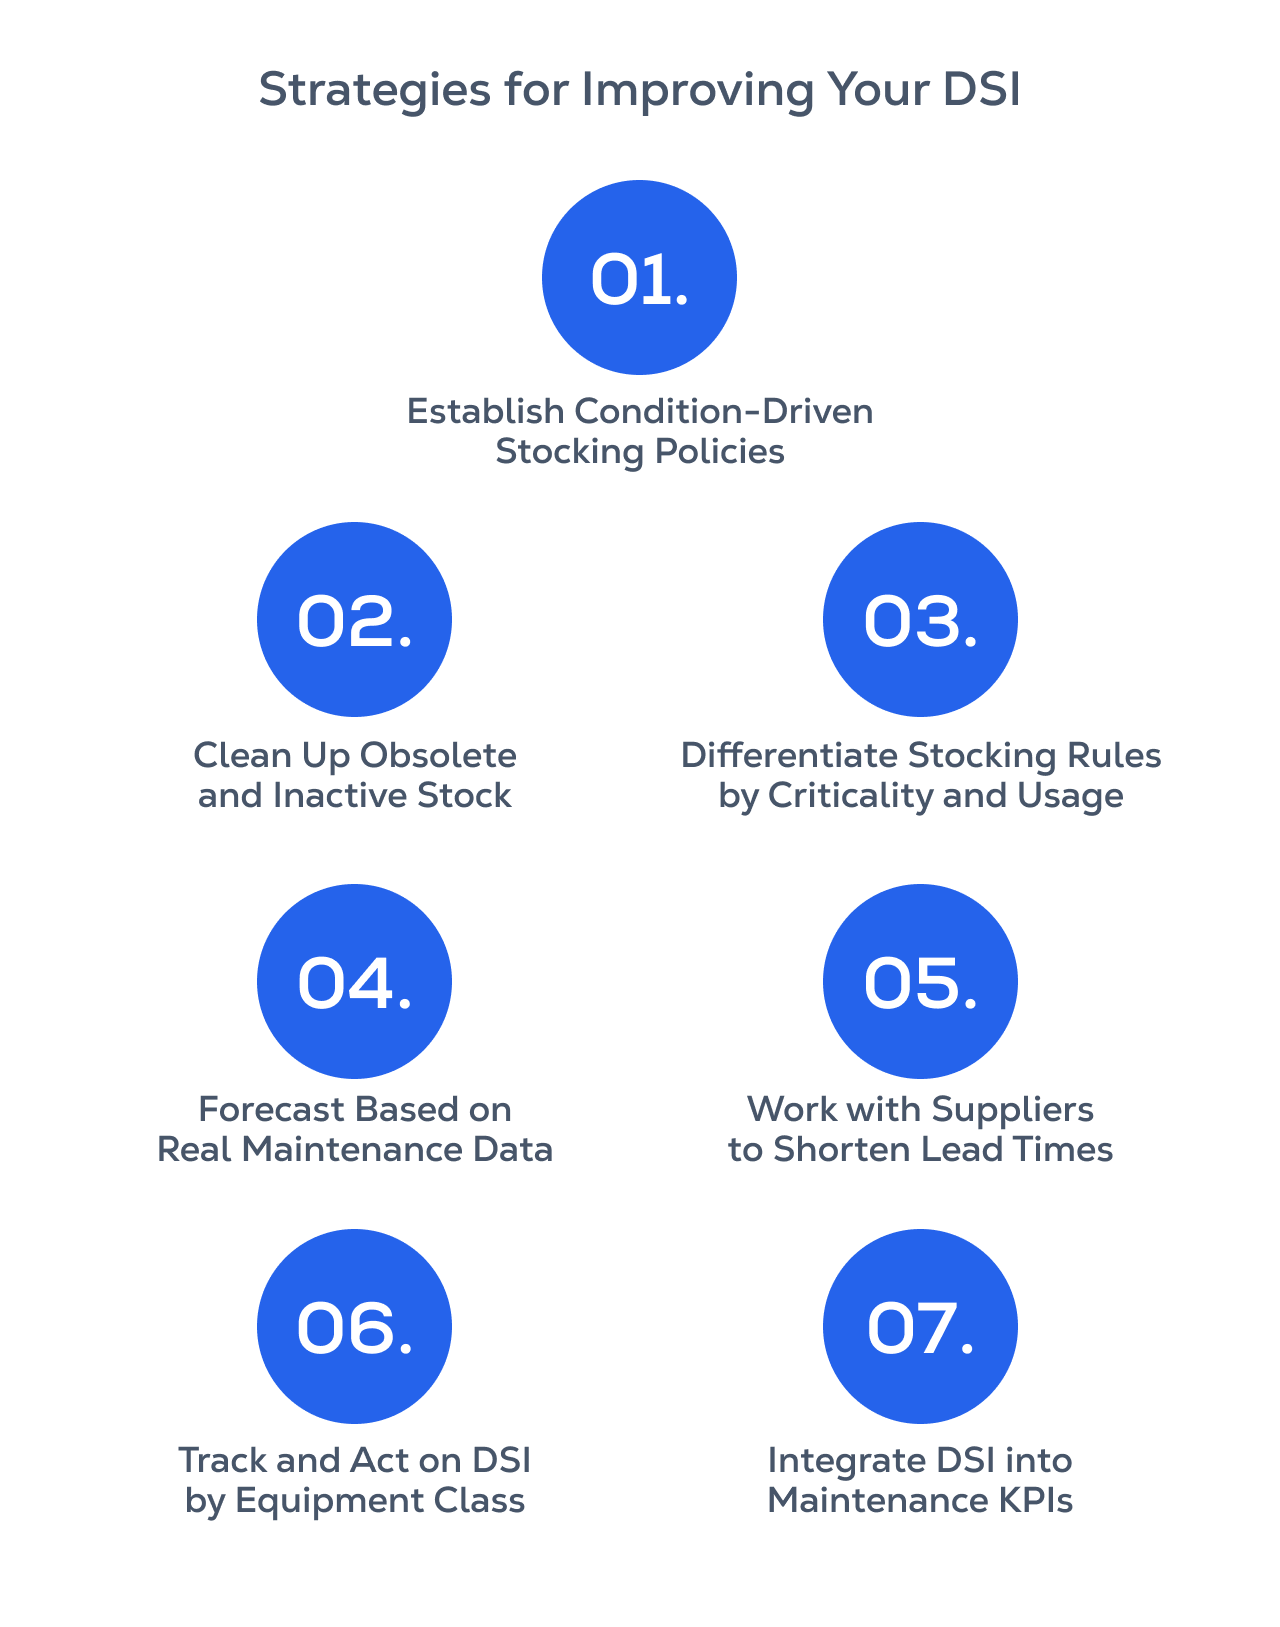
Strategies for Improving Your DSI
There’s no shortcut to better DSI. It requires tight coordination between maintenance, procurement, and operations to ensure every part held in inventory serves a purpose tied to asset reliability or production continuity.
For maintenance leaders, improving DSI reshapes how inventory decisions are made across the entire asset lifecycle.
1. Establish Condition-Driven Stocking Policies
Static min-max levels, especially for critical spares, almost always result in inflated DSI. Parts sit because there’s no live connection between asset health data and replenishment triggers.
Linking inventory decisions to real-time condition monitoring and predictive maintenance systems ensures parts arrive (are reordered) only when the machine’s condition justifies it.
2. Clean Up Obsolete and Inactive Stock
A significant portion of high DSI comes from parts that are either for decommissioned equipment, purchased under outdated preventive plans, or simply misclassified as critical.
Conducting annual inventory rationalization audits, with input from both maintenance and reliability teams, is critical to shrinking DSI without compromising uptime.
3. Differentiate Stocking Rules by Criticality and Usage
A blanket stocking policy for all parts guarantees DSI inefficiency. Fast-moving consumables, slow-moving safety spares, and parts with high obsolescence risk all require different replenishment rules.
Classify parts into operational tiers and adjust reorder points, safety stock levels, and review cycles accordingly.
4. Forecast Based on Real Maintenance Data
Many high-DSI plants suffer from procurement cycles disconnected from maintenance realities. If purchasing relies on forecast models that don’t account for actual failure rates, maintenance schedules, and consumption patterns, overordering is inevitable.
Combining historical work order data with real-time asset health insights closes this gap.
5. Work with Suppliers to Shorten Lead Times
Long supplier lead times drive inflated DSI because plants have no choice but to over-purchase to offset supply risk.
Proactively renegotiating lead times or building vendor-managed inventory agreements with critical suppliers helps shift this burden outside the plant, reducing both DSI and working capital pressure.
6. Track and Act on DSI by Equipment Class
Global DSI averages across the entire MRO inventory hide valuable insight. Maintenance teams should segment DSI by equipment type or production line to identify where excessive stockholding is concentrated.
In many cases, a small percentage of equipment drives the majority of spare parts inventory, meaning targeted DSI improvement efforts can deliver oversized results.
7. Integrate DSI into Maintenance KPIs
Treating DSI as a core maintenance performance indicator - alongside MTBF, downtime hours, and PM compliance rates - shifts the perception of inventory from a procurement-only issue to a shared operational responsibility.
When maintenance teams have visibility into DSI and see how it tracks against asset reliability goals, inventory decisions become more intentional and more defensible.

How Tractian’s CMMS Helps Optimize DSI and Inventory Management
When maintenance teams control DSI and optimize inventory, they unlock a smarter, more responsive maintenance process. Parts arrive when they’re needed, rather than months too early or days too late.
Working capitall is applied to reliability improvements instead of sitting idle in overstocked shelves. And most importantly, critical assets stay protected without forcing procurement teams into last-minute firefighting.
Process control and visibility is exactly what Tractian’s CMMS delivers.
Everywhere it’s implemented, Tractian’s CMMS is helping maintenance teams move away from manual tracking and fragmented spreadsheets into a fully connected inventory management and asset monitoring ecosystem.
With real-time asset condition data feeding directly into parts usage trends, Tractian helps teams automatically align inventory strategies with actual equipment health.
Instead of relying on static reorder points that rarely reflect evolving machine conditions, Tractian users gain dynamic visibility into which parts are being consumed, which are aging on shelves, and how to prioritize based on asset criticality and failure risk.
Tractian’s CMMS transforms inventory from a disconnected, fragmented cost center into a fully integrated part of your operation’s reliability strategy.
Optimized inventory starts with real-time insights. Discover how Tractian’s CMMS connects asset health to smarter inventory management