REAL-TIME VIBRATION ANALYSIS
Your Vibration Analysis Workspace
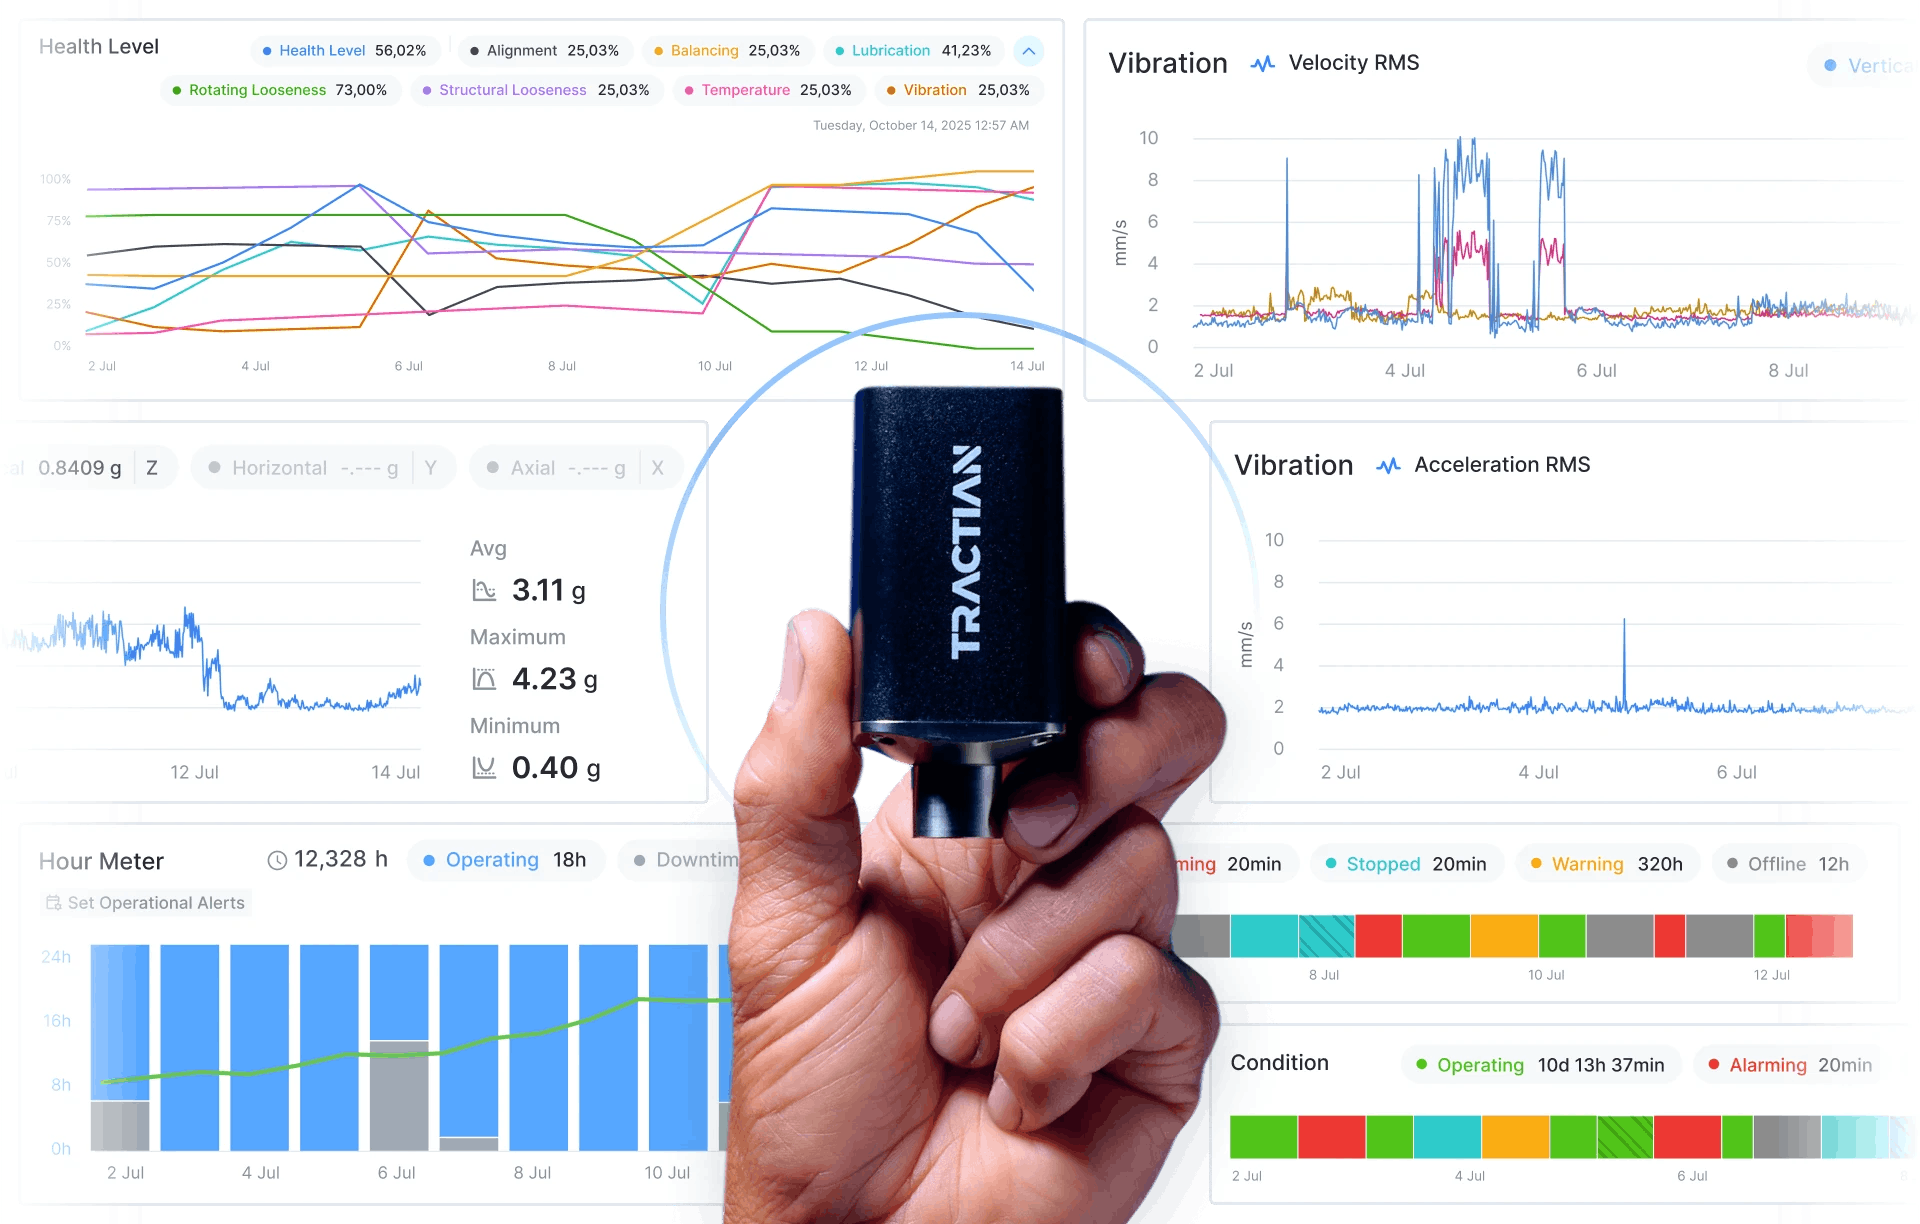
Tractian gives you the visibility and tools to diagnose failure modes in real time - remotely and reliably.
Your Vibration Analysis Workspace
Tractian gives you the visibility and tools to diagnose failure modes in real time - remotely and reliably.
A TRUE VIBRATION WORKSPACE
DESIGNED FOR EXPERTS. CLEAR FOR EVERYONE
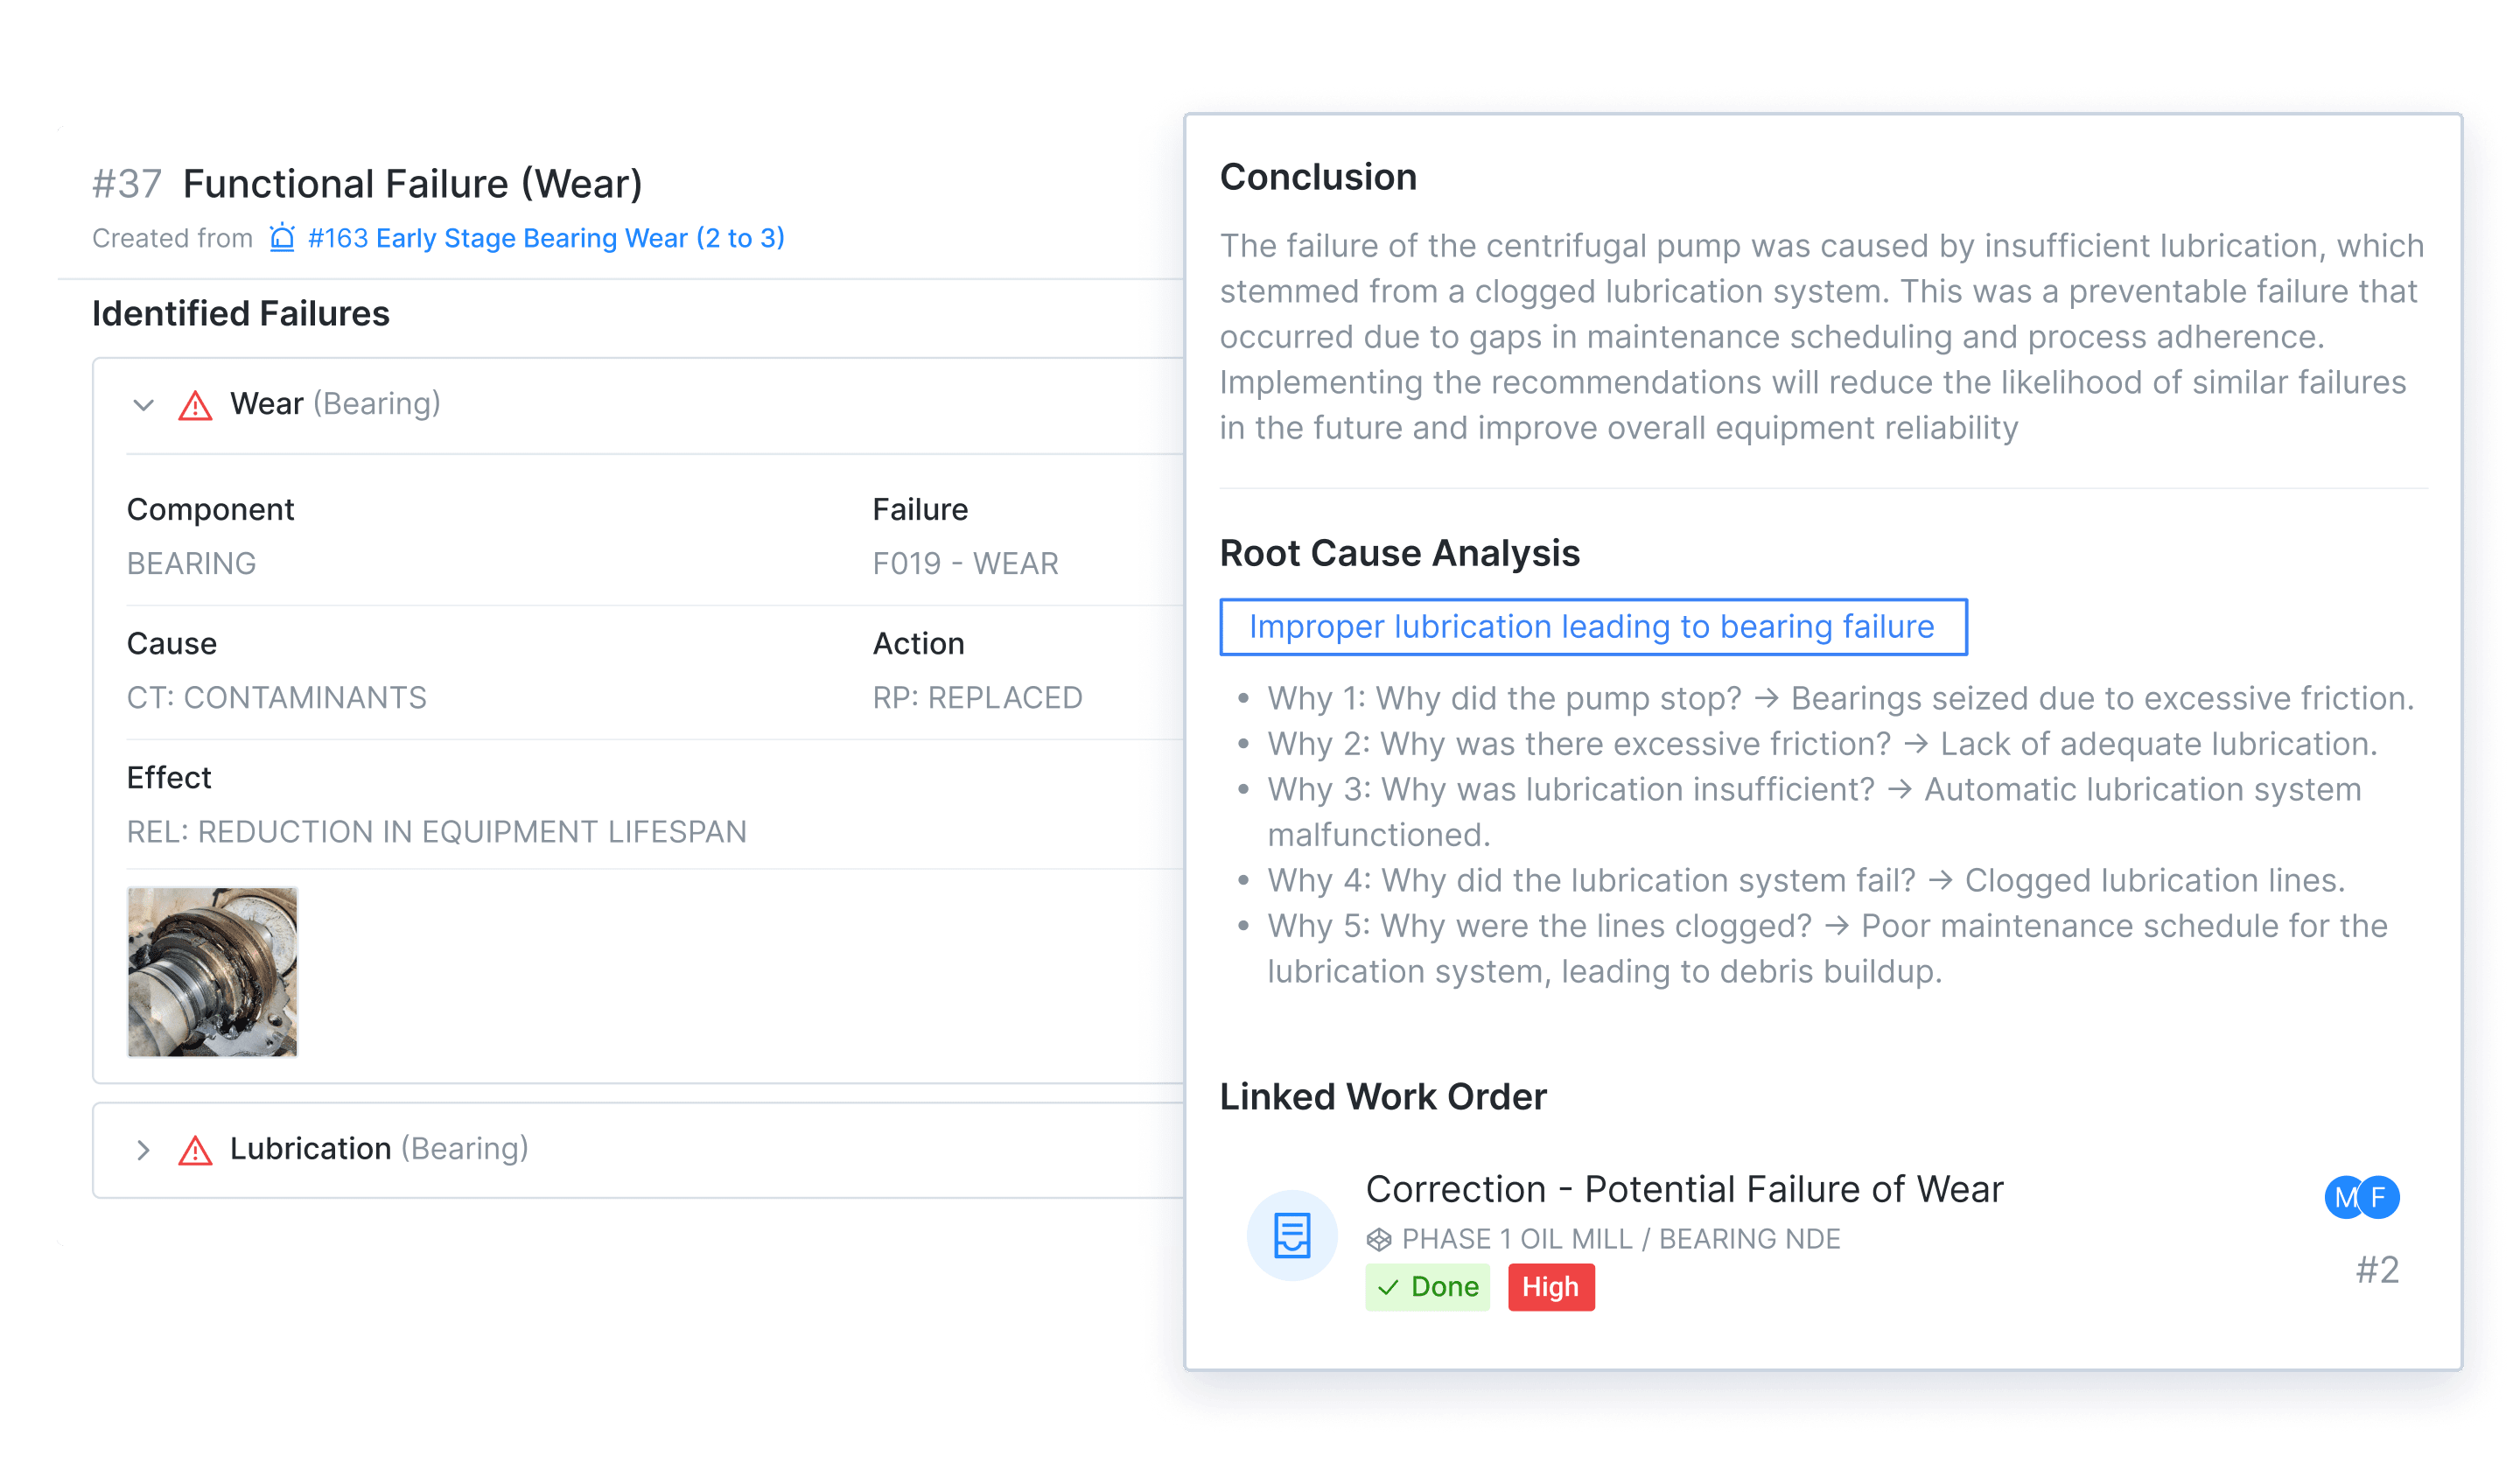
Tractian AI pinpoints root causes automatically using vibration signatures.
These insights are validated against historical failures, frequency libraries, and expert -reviewed data, giving your team the confidence to move faster and focus their attention where it matters most.
Bearing Erosion
Bearing Wear
Belt Wear
Blade Passage
Overvoltage
Overload
Operational Problems
Phase Unbalance
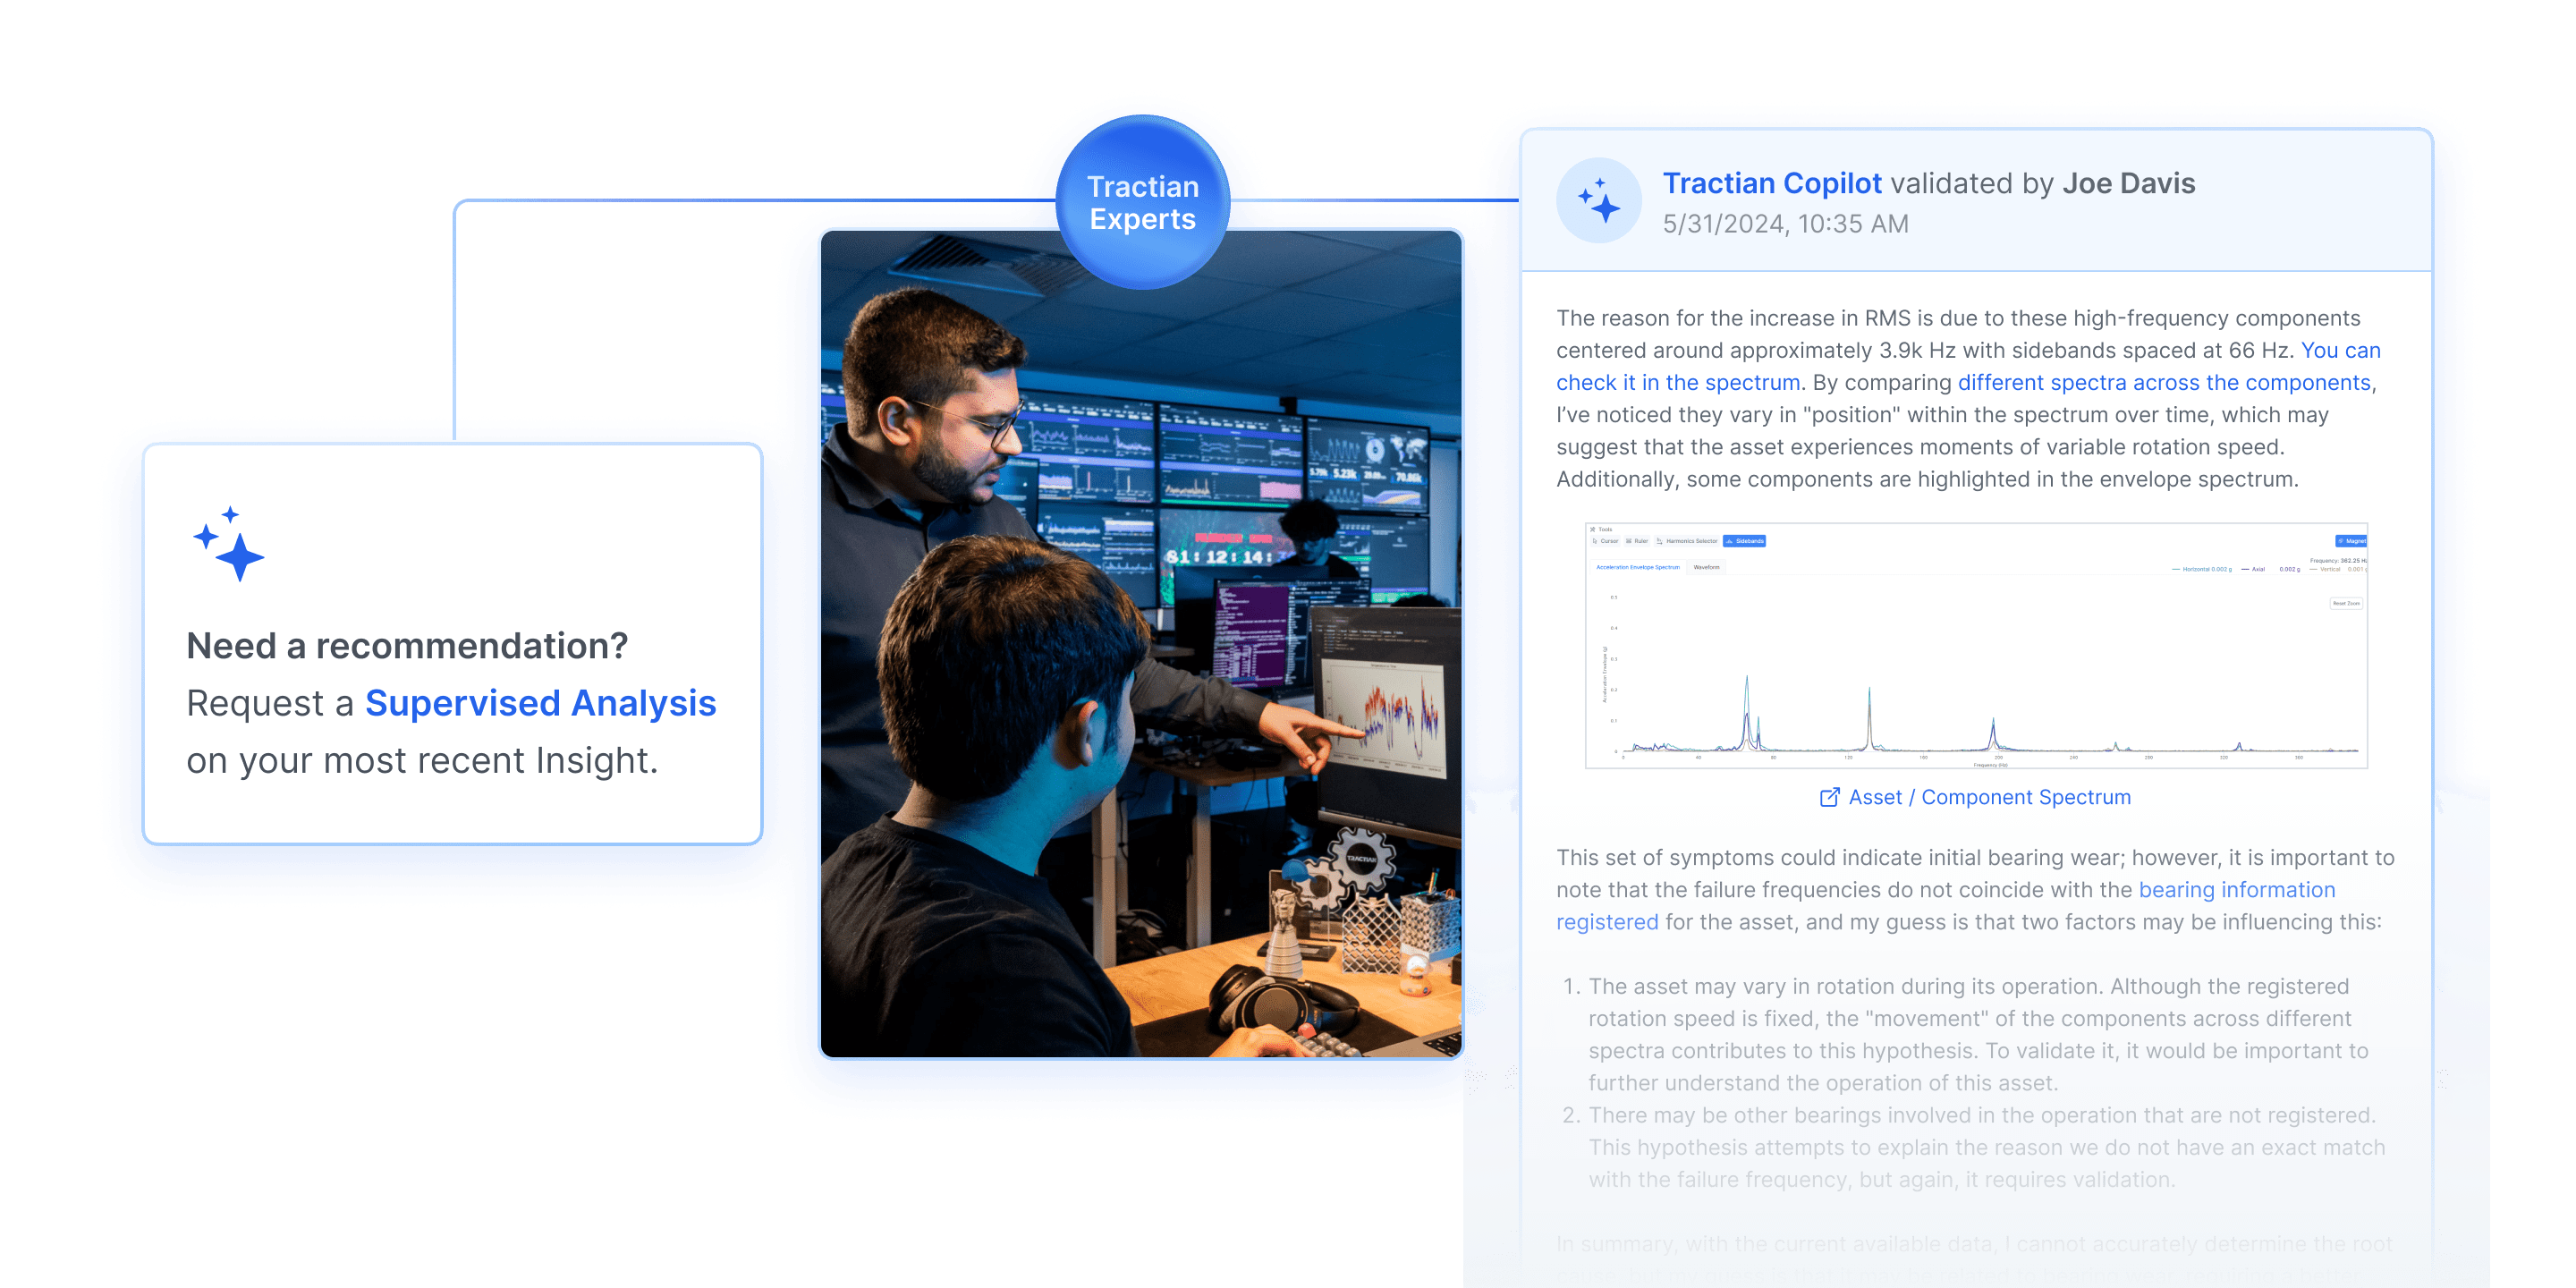
EXPERT VALIDATION WHEN IT COUNTS
Not every alert needs a manual review - but when it does, our supervised analysis feature connects you with expert-vetted insights. Ideal for non-vibration experts or teams validating high-impact alerts.
Set up specific data samples to extract key information from different assets.
Auto Diagnosis™ Sample
Automatic, AI-powered sampling every 30 minutes. Record vibration, acceleration, and envelope acceleration to identify faults with precision, adapting to asset behavior for continuous monitoring without manual intervention.
Trend Sample
For short-interval monitoring, this mode samples velocity and acceleration data such as RMS, Peak-to-Peak, and Crest Factor. Ideal for identifying patterns and efficiently planning preventive maintenance.
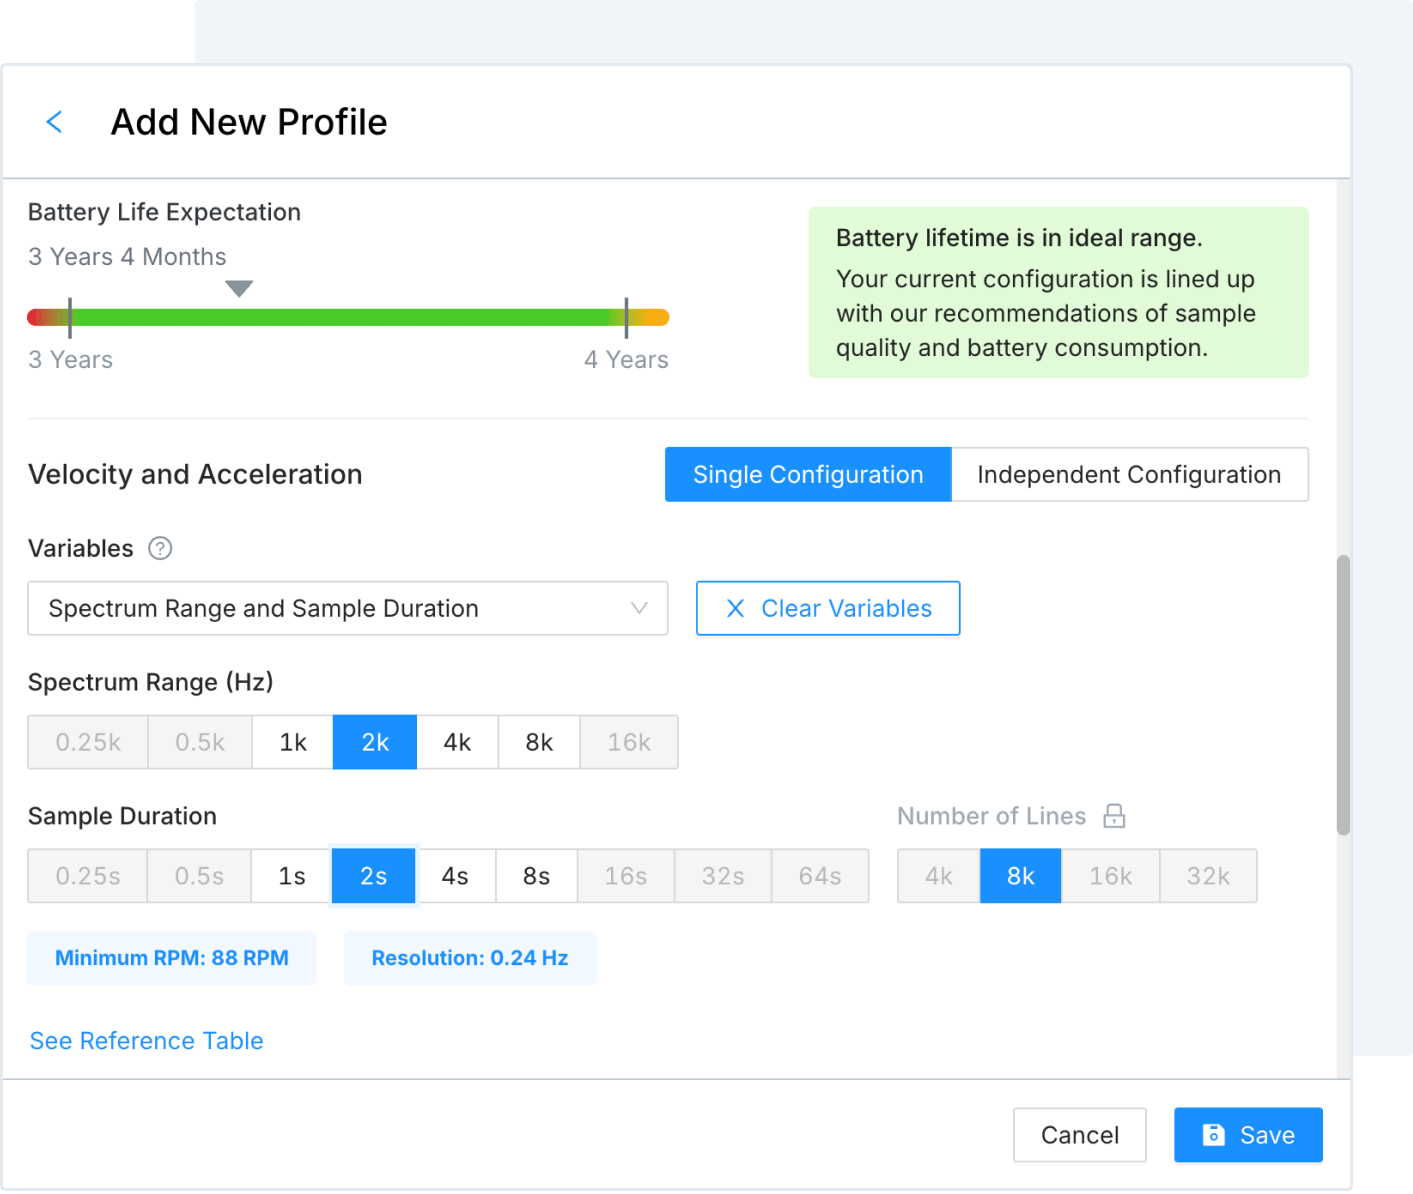
Expert Sample
Provides full autonomy in adjusting parameters such as sample duration and resolution, spectrum interval, and number of lines, offering flexibility for in-depth, on-demand diagnostics with uncompressed data.
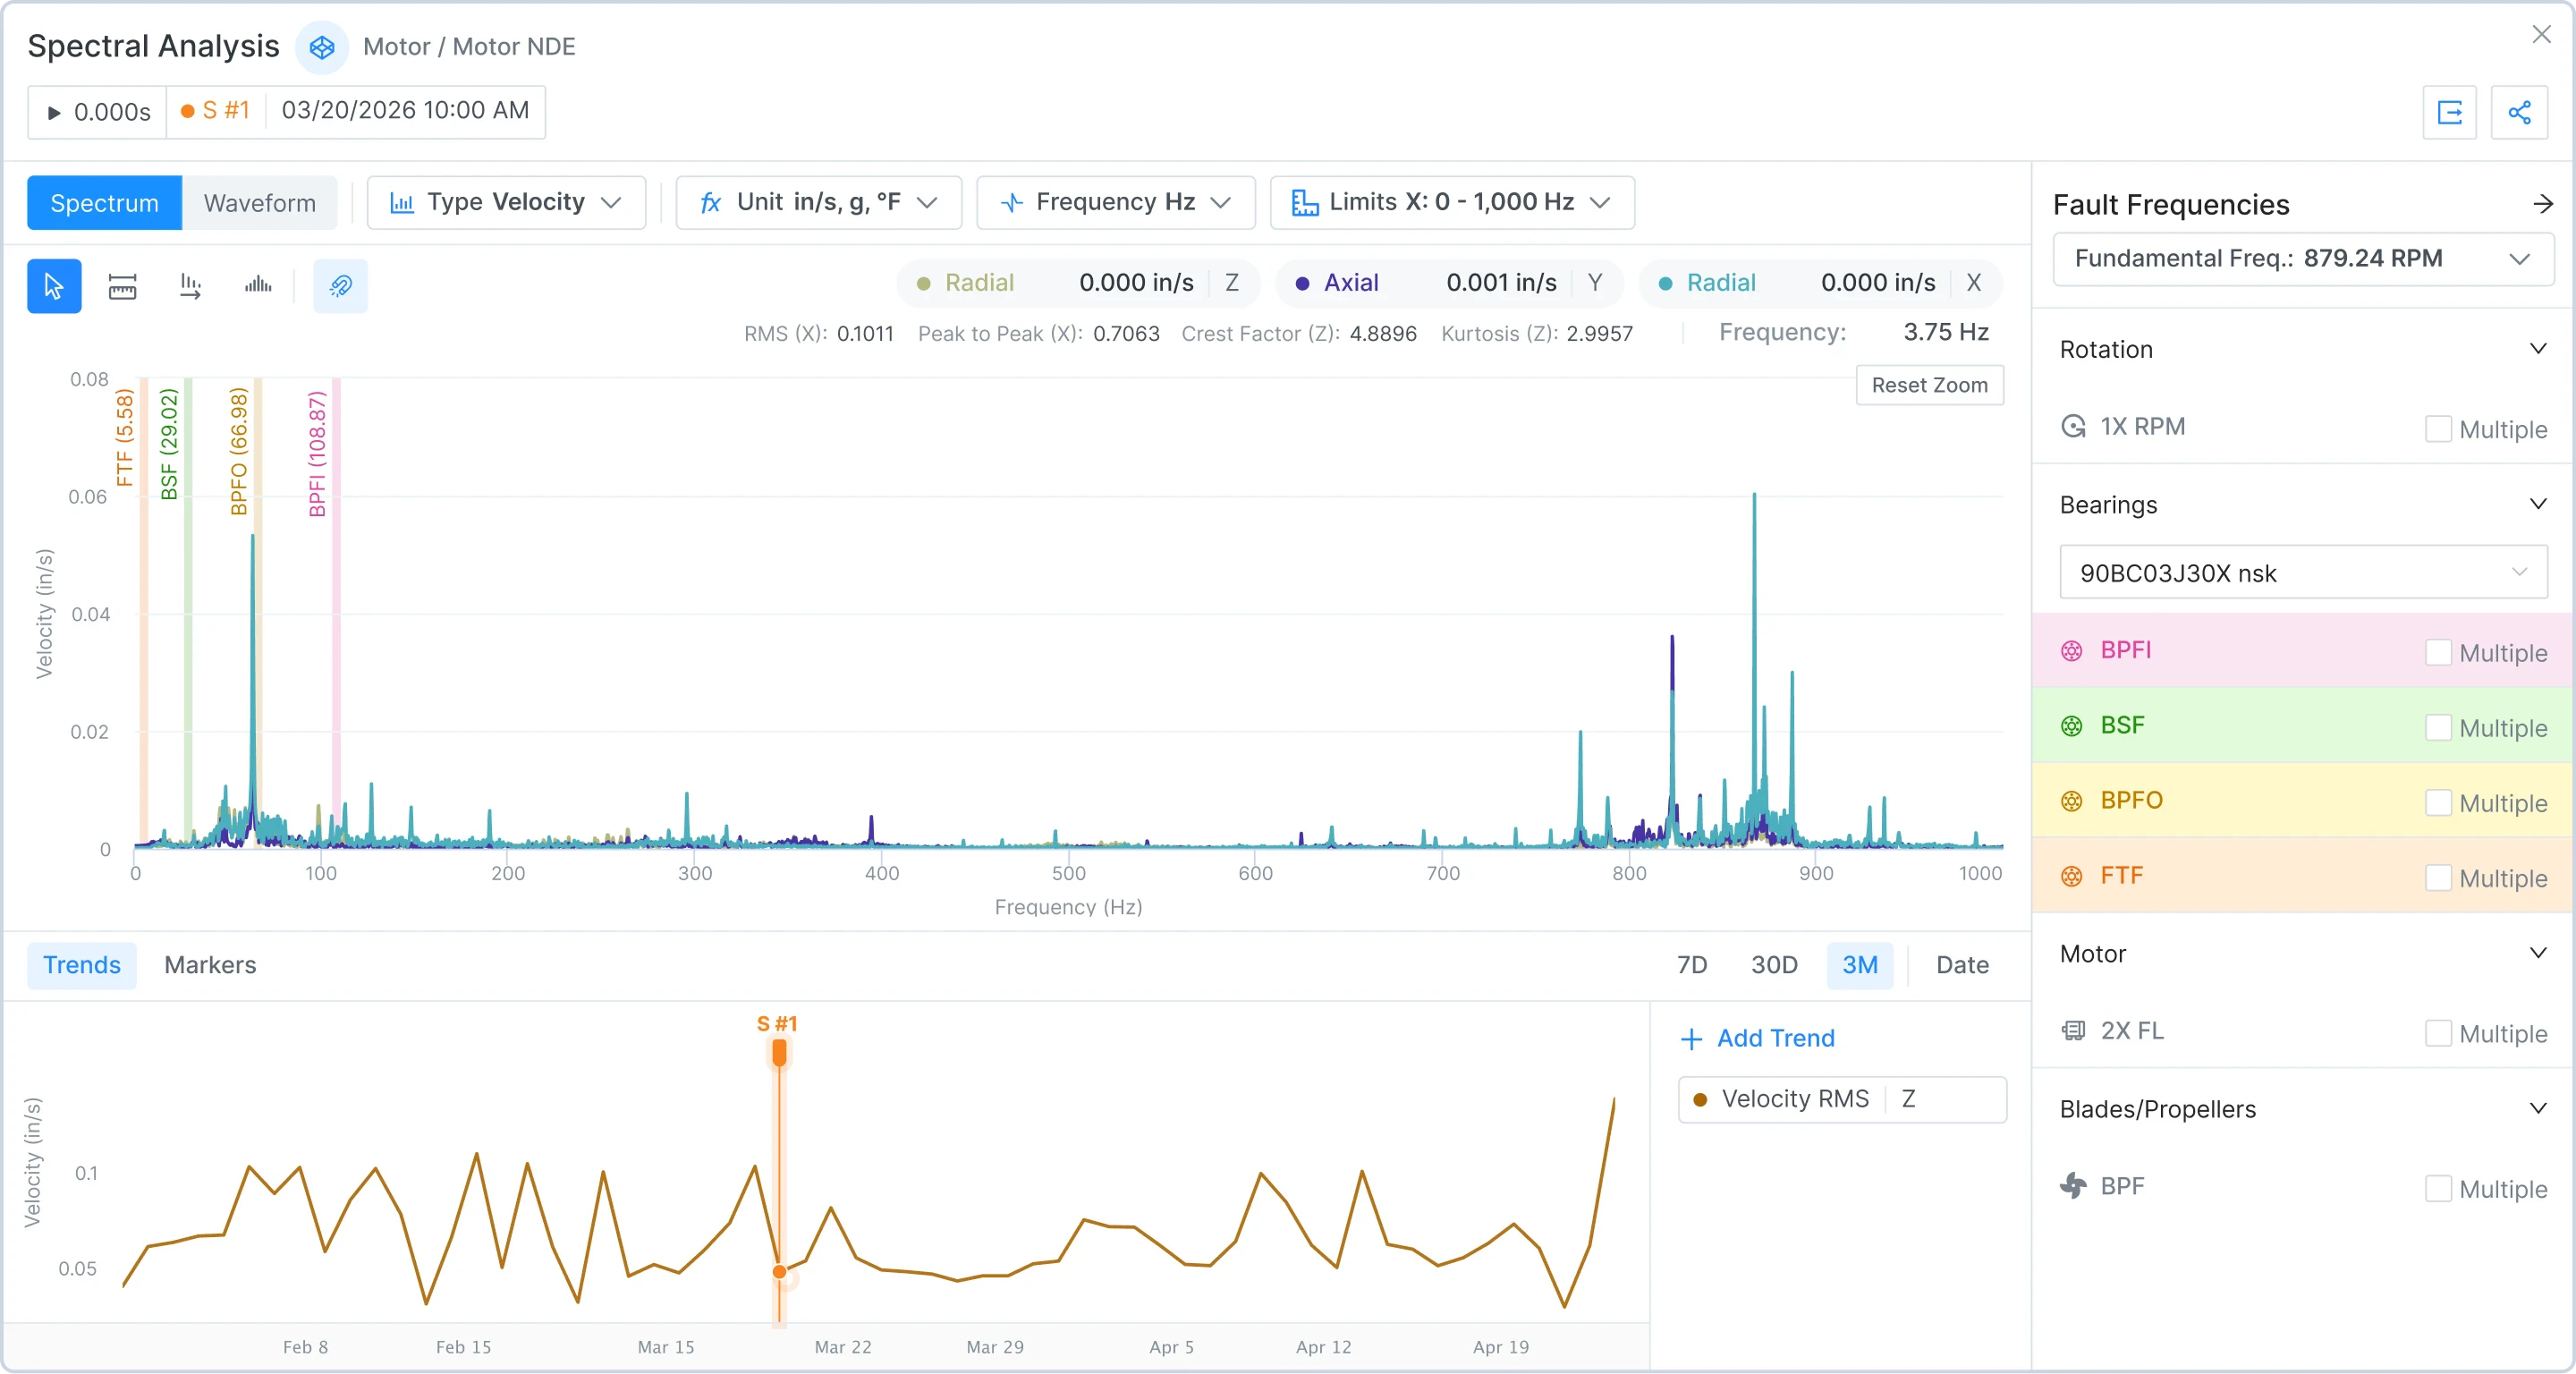
The Spectral Analysis tool allows you to identify issues in your machinery and detect fault frequencies such as BPFI, BPFO, and GMF.
Cursor
An essential tool for highlighting specific points in the spectrum, such as frequencies or amplitudes.
Ruler
Calculates the distance between points in the spectrum, like the distance between a fundamental frequency and its harmonics.
Harmonics Selector
Helps identify harmonic frequencies or multiples of a fundamental frequency.
Sidebands
Identifies peaks around a primary frequency, typically resulting from modulation.
BEST-IN-CLASS HARDWARE. out of the box.
Battery Life
3–5 years
Sampling
Vibration, Trends, and Spectrum up to 64kHz, Temperature, RPM, and Ultrasound
Connectivity
4G/LTE, up to 330 ft with obstacles, 3,300 ft Line of Sight
Temperature Range
-40°F to 250°F
Certified for Hazardous Locations
Class 1 Div 1 (ATEX, IECEx, NFPA compliant)
IP69K Rated
Fully sealed & resistant to water and dust particles
Ready to See It in Action?
FAQ