
Key Points
- Industrial condition monitoring equipment is the hardware and software layer that produces decision-grade information about the health of industrial assets.
- Equipment alone doesn't produce the outcome. Closed-loop execution, AI-driven analytics, and operational infrastructure (training, workflows, procedures) are what convert sensors into a working program.
- The gap between "we have monitoring equipment" and "we have a working monitoring program" compounds quickly under pressure.
Two identical plants, two different programs, one year
Two identical plants have the same machines, KPIs, and maintenance teams. Everything is the same except their monitoring program and operational approach. They start the year, and this is Day 1.
In Plant A, the maintenance team begins the year the way they ended the last one. Handheld vibration meters on the bench, inspection routes printed for the week, scheduled PMs on the calendar, and a handful of legacy wired sensors on the most critical assets. The approach has worked well enough to keep production running. Most of the time.
In Plant B, the team begins Day 1 differently. The plant has just implemented a condition-based maintenance program from the ground up. Continuous AI-driven monitoring with wireless sensors across the critical assets. Closed-loop work order execution with SOPs attached to each insight. Completion data is fed back into the platform. Rewritten workflows. Training was rolled out for technicians and engineers. One staff member has been reassigned to a dedicated program manager to support implementation.
By Month 12, the two plants will no longer be operationally comparable. This article walks through what changes between them at each interval, what the role of industrial condition monitoring equipment turns out to be, and what it requires as an operational environment for it to succeed.
Month 1, Baselines and Blind Spots
At thirty days, the two plants still look the same on paper, but the people running them are already operating with very different information.
In Plant A, the maintenance technician starts a Monday at six. The handheld vibration meter is on the bench, the clipboard is on the cart, and the inspection route covers the same eleven assets it covered last Monday. By the end of the shift, readings are entered into the spreadsheet the reliability engineer will reconcile on Tuesday. Two assets that ran intermittently last week aren't on the route, because the route covers scheduled rounds rather than known intermittents.
In Plant B, the maintenance technician starts on Monday at six as well. The mobile app opens to a queue that didn't exist a month ago. The Smart Trac sensors on the critical assets have completed their first health baselines, and the reliability engineer is reading the Initial Health Report side by side with comparable machines from the platform's database. The intermittent assets that worried the team on Day 1 are no longer a mystery. They're monitored continuously and trended against a reference.
The first thirty days don't produce dramatic outcomes. They produce an asymmetry that will begin to sharply compound. Plant A's engineers are still reconstructing data after the fact. Plant B's engineers are reading it live, with the equipment doing the gathering work that was previously done by hand.
Month 3, The First Real Test
At ninety days, one plant detects a developing fault on a critical asset. The other has the same fault going unnoticed.
In Plant B, a Smart Trac sensor on one of the plant's critical assets, a 250-horsepower process motor, flags a developing bearing condition on a Tuesday afternoon. The platform classifies the failure mode, assigns severity, and generates a work order with an attached SOP from the Procedures Library. The reliability engineer opens the spectral analysis workspace and traces the signature back through two weeks of trend data.
The fault didn't appear overnight. It progressed quietly during the same hours the previous inspection round would have missed. The work order is scheduled for Thursday's planned production gap. The technician executes the bearing replacement in three hours. Production loses nothing.
In Plant A, a similar process motor reads fine on the most recent route. No anomaly has been logged. On Wednesday morning, the plant manager asks the maintenance manager, "How healthy is our most critical asset right now?" The answer is, "I'll get back to you." The maintenance manager checks the latest inspection record, pulls the historical PM file, and walks to the motor with a handheld meter. The answer arrives mid-afternoon. By then, the question has moved on.
The cost of Tuesday's catch in Plant B won't show up in any one report. The cost of Wednesday's missed signal in Plant A will eventually be in the ledger after the next unplanned event.
Month 6, Programs Mature or Stall
At six months, the workflows have either matured into something the team relies on or fragmented into something the team works around.
In Plant B, the technician's day no longer starts at the bench. Instead, it begins in the mobile app with an AI-prioritized queue. Each work order opens with the asset's recent condition trend, the suspected fault, and the SOP for the recommended action. QR codes posted on each asset open the maintenance history in two taps. The walk between assets is shorter because the work is prioritized rather than routed.
The reliability engineer in the same plant is spending less time gathering data and more time using it. The FMEA library is being updated with closed-event findings. RCAs go in faster because the trend data and the completion notes share the same workspace. There's now a meaningful difference between "what we know about our assets" and "what one senior engineer remembered about our assets."
In Plant A, a critical asset failed in week 19. The team brought it back online inside thirty-six hours, but the production loss is in this month's reporting. The post-incident review traces the cause back to a reactive maintenance loop the team has been trying to break for years. The senior engineer who diagnosed the fault is the same senior engineer who diagnosed the last three. He's also the same engineer who is two years from retirement.
Here, a critical moment surfaces that reveals how labor scarcity dramatically compounds the situation, and the difference between approaches.
The technicians and engineers who have the operational knowledge are retiring faster than the pipeline can replace them. Plant B's program has quietly removed that dependency by codifying what the senior engineer knows into trended data, attached procedures, and AI-assisted diagnostics that anyone on the team can read.
Twelve Months of Divergence
Mean Time Between Failures on critical assets, Plant A vs. Plant B
Both plants begin Day 1 identically. The gap compounds over twelve months as Plant B's condition-based program detects faults earlier and converts insights into planned work, while Plant A absorbs reactive wear.
Month 12, The Two Plants Diverge
At twelve months, the two plants are no longer operationally comparable, even though they remain comparable on paper.
In Plant B, the maintenance manager opens the live KPI dashboard the morning of the year-end review. MTBF on critical assets is up roughly a quarter over the Day 1 baseline. MTTR is down. The planned-to-reactive ratio has shifted toward planned. Wrench time has expanded because technicians spend less time looking for the cause and more time fixing it. The dashboard is what gets presented. It doesn't need a slide deck behind it.
In Plant A, the maintenance manager is preparing for the same year-end review. Reports are being assembled from three spreadsheets, two ERP exports, and a sequence of emails confirming the dates of the year's three significant downtime events. The plant manager will need a narrative to explain the emergency capex request, because the numbers alone don't tell the story.
The two plant managers sit in the same kind of room, in front of the same kind of leadership team, on the same week. One walks through asset health backed by twelve months of trended data. The other walks through three breakdowns and what each costs. One conversation is about the next phase of investment. The other is about how to prevent the next event.
By the time both reviews are over, the comparison is no longer about which plant has better equipment. The equipment Plant B installed on Day 1 was a sensor. The outcome at Month 12 isn't a sensor's outcome. It's the outcome of a closed-loop program.
The hardware made it possible. The closed loop, the analytics, the workflow rewrites, the training, and the dedicated implementation infrastructure made it actual.
What Industrial Condition Monitoring Equipment Demands
Four requirements. All four required. None of them optional.
Strip any one out and the equipment becomes data no one acts on.
What Industrial Condition Monitoring Equipment Really Demands
The lesson Plant B's trajectory makes visible is that equipment alone doesn't produce the outcome. What's required is a system of equipment, intelligence, execution, and operational infrastructure working as one.
Four requirements separate condition monitoring equipment that ranks on a feature list from condition monitoring equipment that produces what Plant B produced.
Sensors engineered for industrial conditions
Industrial assets sit on factory floors with washdown protocols, hazardous-area classifications, and ambient temperature swings that would shut down lighter-duty hardware. The sensor itself has to be ruggedized, wireless by default for deployment across distributed assets, and capable of multi-modal sensing so signal coverage matches the failure modes that actually occur.
AI that produces decisions, not data
Raw vibration spectra are not a decision. A red-yellow-green alarm isn't a decision either. A decision is a fault classification, a severity rating, and a recommended action the technician can execute without escalating to an expert.
Closed-loop execution
Detection without execution is data. The system has to generate work orders directly from insights, carry attached procedures for the recommended action, accept completion back from the technician, and use the data to refine future diagnostics. Manual handoffs between detection and action are where confidence and capacity leak.
Program infrastructure
Training, workflow rewrites, dedicated implementation support, and access to expert validation when complex faults arise. The equipment is the entry point. The program is what makes it real.
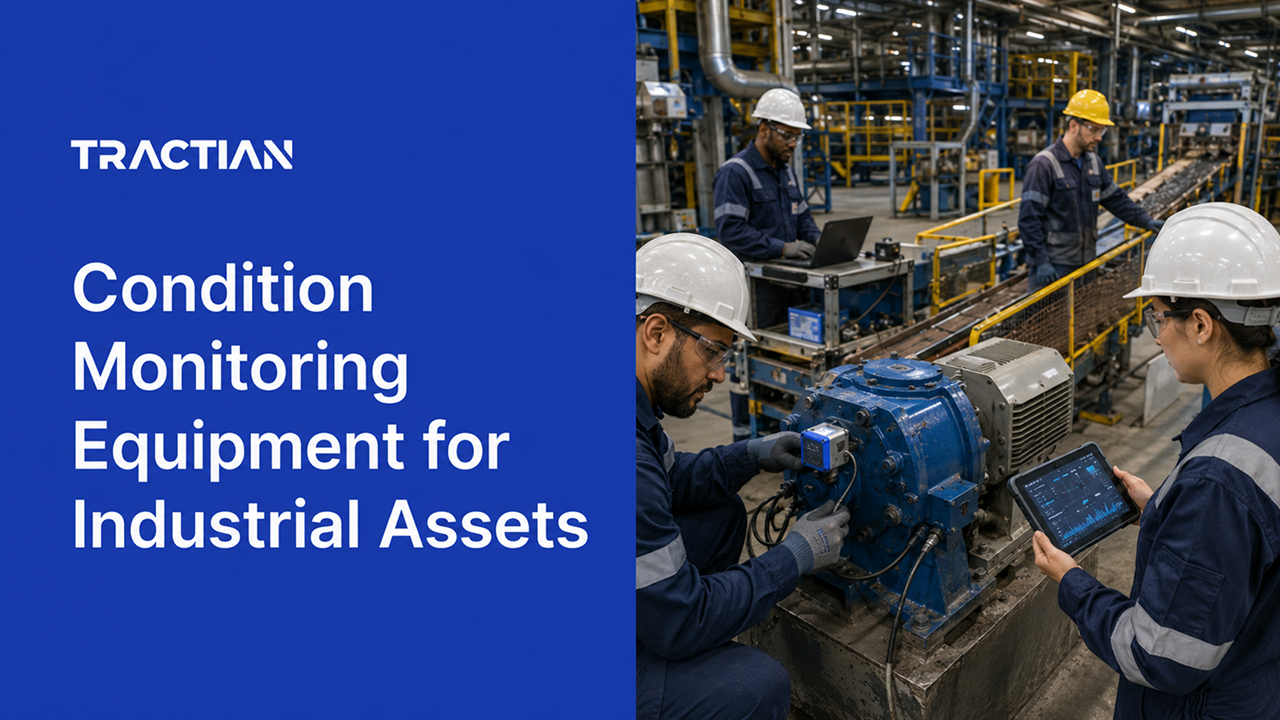
Tractian Provides Both the Equipment and the Program
Tractian is designed and built to transform Plant A into Plant B with industrial condition monitoring equipment, plus the infrastructure to make it succeed.
Hardware built for the floor
The Smart Trac sensor is the equipment.
- Multi-modal sensing across vibration, ultrasound, magnetic field, and temperature.
- IP69K rated, hazardous-location certified for ATEX, IECEx, and NFPA 70 Class 1, 2, and 3 (Division I).
- Operating range from -40°F to +250°F.
- Wireless to the Smart Receiver on sub-GHz frequencies, with 48 hours of offline storage when connectivity drops.
AI that produces decisions, not data
The AI layer is what turns sensor data into decisions. Auto Diagnosis covers all major failure modes, run by patented fault-finding algorithms against a model trained on 3.5 billion+ samples from comparable assets worldwide. Insights arrive with severity, root cause, and a recommended action. An Initial Health Report is provided within 5 days of installation, with full calibration at 15 days. The model improves through human-in-the-loop feedback as verified outcomes flow back in.
Insights that become work orders
The platform converts insights into executed maintenance without manual handoffs. Each insight generates a work order with an attached SOP from the Procedures Library. Technicians execute through the mobile app, online, or offline. Completion data flows back to refine future diagnostics.
A Tractian-enriched CMMS integrates as a unified platform that covers preventive scheduling, KPI dashboards, parts and inventory, and custom supervisors. It's what makes the loop's executable components possible.
Implementation with results
The program infrastructure is what makes the equipment succeed in practice. Dedicated program managers run the installation. Expert-led integrations connect Tractian to existing ERP systems. And, training is included, with 24/5 support available. The APM module provides FMEA, RCA, and Supervised Analysis for the complex faults that benefit from expert validation.
Learn more about Tractian's condition monitoring solution for industrial assets to see how high-quality, decision-grade IoT data transforms your program into AI-powered closed-loop maintenance workflows.
FAQs about Industrial Condition Monitoring Equipment
What is industrial condition monitoring equipment?
Industrial condition monitoring equipment is the combined hardware and software that produces decision-grade information about the health of industrial assets. It includes sensors, data infrastructure, and the analytics platform that turns raw signals into fault classifications, severity ratings, and recommended actions.
What's the difference between condition monitoring equipment and a condition monitoring program?
The equipment is the hardware and software layer. The program is the equipment plus the workflows, training, and closed-loop execution that make adoption real. Equipment without the surrounding program produces data that the team rarely acts on.
How is wireless condition monitoring different from wired sensor systems for industrial assets?
Wireless sensors deploy faster, scale across more assets, and eliminate the wiring infrastructure costs that limit coverage in legacy systems. Tractian's Smart Trac sensor uses sub-GHz wireless to the Smart Receiver with 4G/LTE backhaul, with no dependency on plant Wi-Fi.
How quickly does a new condition monitoring program produce useful insights?
Tractian's Smart Trac sensor produces an Initial Health Report at five days, with full calibration completed at 15 days. Closed-loop work order execution begins as soon as the first verified insight arrives.
What does success look like for an industrial condition monitoring program?
Higher MTBF, lower MTTR, a planned-to-reactive ratio that shifts toward planned, and live KPI visibility for managers. The reliability team gains capacity for asset strategy work that previously got displaced by firefighting.