
Key Points
- Sensor networks with threshold alerting collect continuous machine data but leave all diagnostic decisions to the user, requiring manual interpretation and separate tools to act on the findings.
- Analyst-driven monitoring services add a human diagnostic layer that converts data into recommendations, but the speed and depth of those recommendations are constrained by the analyst's availability and capacity.
- AI diagnostic platforms with a managed expert overlay automate fault detection and prescriptive guidance at scale, but the path from diagnosis to maintenance action still requires a handoff to external systems.
- Assembled monitoring and maintenance ecosystems connect sensors, analytics, and a CMMS within a single vendor's portfolio, but the components were built independently, and their integration may introduce friction.
- Closed-loop condition intelligence and execution platforms handle the full workflow from detection to diagnosis to work order to completed repair within a single native system, with diagnostic accuracy that improves over time through feedback from verified maintenance outcomes.
What is a Condition Monitoring System?
A condition monitoring system is more than a sensor mounted to a machine. It is the combination of hardware, software, and diagnostic logic that work together to detect changes in equipment health and translate them into information a maintenance team can evaluate. The distinction matters because a sensor by itself collects data, but a system does something with it.
The threshold at which hardware becomes a system is the point where data acquisition connects to interpretation. At a minimum, this means sensors are paired with a platform that receives their output, applies some form of analysis or comparison (even if only against static thresholds), and presents the result to a user.
Once that loop exists, from physical measurement to digital interpretation to human-facing output, the term "system" applies. Everything below that threshold is instrumentation. Everything above it varies in how much of the decision-making process the system handles on its own.
That variance is significant. Some condition monitoring systems stop at data collection and visualization, leaving every diagnostic judgment to the person reviewing the dashboard. Others automate fault identification, attach recommended procedures, and route the finding directly into a maintenance workflow without requiring a human to bridge the gap. The system type a team selects determines not only what data they receive but also how much of their own time, expertise, and manual effort is required to convert data into a completed maintenance action.
For teams evaluating their options, the question isn't whether a product qualifies as a condition monitoring system. It's how much of the path from detection to resolution the system covers, and where the gaps your team will need to fill are.
Types of Condition Monitoring Systems
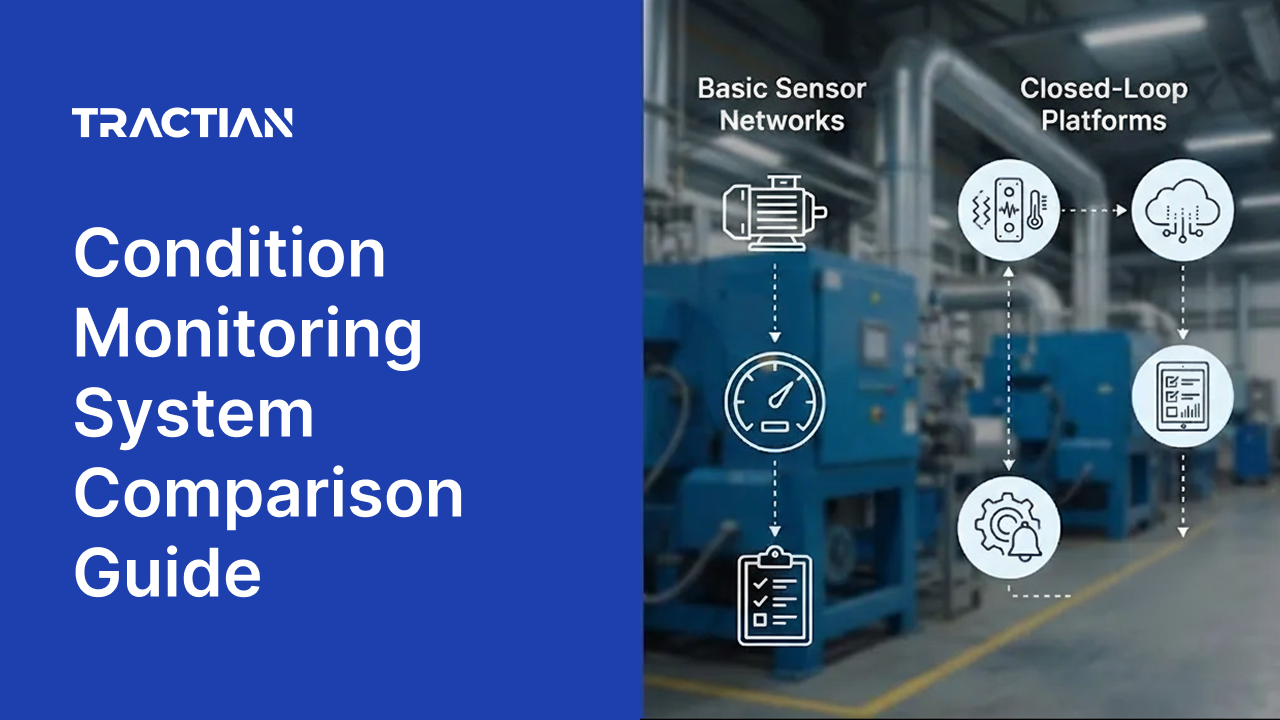
Condition monitoring systems exist on a spectrum. At one end, a basic sensor network collects machine data and presents it on a dashboard for a human to interpret. At the other end, a closed-loop platform detects anomalies, diagnoses the fault, recommends corrective actions, generates a work order, and feeds the outcome back into its learning model to improve future diagnostics. Between those endpoints, several distinct system types occupy different positions based on two structural factors.
The first is diagnostic autonomy.
This is who or what interprets the data. This ranges from the user alone (reviewing threshold alerts) to a dedicated human analyst to an AI engine to a combination of AI with closed-loop learning.
The second is execution proximity.
This is how far an insight has to travel before it becomes a completed maintenance action. This ranges from fully manual (the user takes the finding to a separate tool or process) to fully native (the platform generates the work order automatically within the same interface).
These two factors define five system types. Each one represents a structural step up in capability, not just in features, but in how much of the condition monitoring workflow the system handles without adding steps, tools, or dependencies.
The types, from most basic to the most comprehensive, are:
- Sensor Network with Threshold Alerting
- Analyst-Driven Monitoring Service
- Diagnostic Platform with Managed Expert Overlay
- Assembled Monitoring and Maintenance Ecosystem
- Closed-Loop Condition Intelligence and Execution Platform
The sections that follow examine each type in detail. We’ll look at what it includes, how diagnostics work, how findings become maintenance actions, and which company represents a strong example of the category.
How to Determine Which Condition Monitoring System Fits Your Operation
Selecting the right condition monitoring system depends on where your maintenance program stands today and where it needs to be in the next 12 to 24 months. Before evaluating vendors, answer these questions internally to clarify what your operation actually requires.
Diagnostic confidence
- When your team receives an alert, do they have enough information to act on it immediately, or do they need to investigate further before deciding what to do?
- If your current system flags an anomaly, does the person reading the alert know the specific failure mode, its severity, and the recommended corrective action, or are they starting from scratch?
- How much time does your team spend confirming whether an alert is real before they begin planning a response?
- If your vibration analyst is unavailable for a week, does your condition monitoring program continue producing actionable output, or does it pause?
Execution proximity
- When a condition-monitoring insight identifies a problem, how many steps, tools, handoffs, or platforms are required before a technician receives a work order with clear instructions?
- Does your team ever lose time re-entering diagnostic findings from one system into another to create a maintenance task?
- If a sensor detects a bearing fault at 2 a.m., how long does it take for someone to be assigned to address it, and is the process automatic, or does it wait for a human to initiate it?
- Can your technicians see machine health data and their assigned work orders in the same interface, or do they switch between tools throughout the day?
Internal capability and labor reality
- If you lost your most experienced reliability engineer tomorrow, would your condition monitoring program continue producing the same quality of diagnostic output?
- Is your team growing, stable, or shrinking, and does your system require more expertise as you scale it to more assets, or less?
- Are you building internal diagnostic capability, or are you becoming more dependent on a vendor's analysts to interpret your own equipment data?
- How many assets can your current team realistically monitor and act on with the tools they have today, and is that number sufficient for your plant's risk profile?
Feedback and continuous improvement
- When a maintenance action is completed, does that outcome feed back into your monitoring system to improve future diagnostics, or does the loop end when the work order closes?
- Is your system getting smarter over time as it collects more data from your specific equipment, or does it perform the same way on day 300 as it did on day 1?
- Can you benchmark an asset's condition against its own history, against similar assets at your facility, and against the same equipment type across the industry?
Scalability without added complexity
- If you doubled the number of monitored assets next quarter, would your current system and team be able to handle the additional diagnostic volume without adding headcount or analyst hours?
- Does your system require plant Wi-Fi infrastructure, or does it operate independently of your IT network?
- Can your system monitor variable-speed equipment, intermittent machines, and assets in hazardous locations without requiring separate hardware configurations or workarounds?
- Are you evaluating condition monitoring systems based on what they detect, or on what your team can do with that data?
These questions aren't designed to point toward a specific vendor. They're designed to clarify whether your operation needs a system that collects data, one that interprets data, or one that turns data into completed maintenance actions without adding steps, tools, or dependencies along the way. The answer will determine where on the spectrum your team should be looking
Condition Monitoring Systems at a Glance
| Feature | Relay | AssetWatch | Augury | Fluke | Tractian |
|---|---|---|---|---|---|
| Type | Type 1 (Sensor Network with Threshold Alerting) |
Type 2 (Analyst-Driven Monitoring Service) |
Type 3 (AI-Diagnostic Platform with Managed Expert Overlay) |
Type 4 (Assembled Monitoring and Maintenance Ecosystem) |
Type 5 (Closed-Loop Condition Intelligence and Execution Platform) |
| Wireless Vibration and Temperature Sensors | ✅ | ✅ | ✅ | ✅ | ✅ |
| Cloud Platform with Trend Visualization | ✅ | ✅ | ✅ | ✅ | ✅ |
| Threshold-Based Alerting | ✅ | ✅ | ✅ | ✅ | ✅ |
| Dedicated Analyst Interpretation | ✅ | ✅ | ✅ | ✅ | |
| AI-Powered Fault Detection | ✅ | ✅ | ✅ | ||
| Prescriptive Alerts with Maintenance Procedures | ✅ | ✅ | |||
| Magnetic Field Sensing | ✅ | ✅ | |||
| CMMS within Vendor Portfolio | ✅ | ✅ | |||
| Integrated Ultrasound Sensing | ✅ | ||||
| Sub-GHz Wireless with Cellular Backhaul | ✅ | ||||
| Native CMMS with Automatic Work Order Generation | ✅ | ||||
| Built-In APM (FMEA, RCA, Failure Libraries) | ✅ | ||||
| Closed-Loop Diagnostic Feedback | ✅ | ||||
| Hazardous Area Certification (ATEX/IECEx), Standard | ✅ |
Condition Monitoring Systems Comparison
From a basic network to a comprehensive closed loop
Sensor Network with Thresholding Alert
Best for: Teams taking their first step from manual or route-based data collection to always-on monitoring, typically for lower-criticality assets or as a pilot before committing to a more complete system.
How does it work?
A sensor network with threshold alerting is a condition-monitoring system that collects vibration, temperature, and other machine data from wireless sensors and transmits it to a cloud dashboard, where users can view trends and receive alerts when predefined thresholds are exceeded. It provides continuous data acquisition and basic anomaly flagging, but it does not diagnose the problem or recommend how to address it. Interpretation and action depend on the user.
Key technologies
This system type typically includes wireless sensors, a communication gateway, and a cloud-based visualization platform. The hardware collects data, the gateway relays it, and the platform displays it.
- Wireless vibration and temperature sensors: Compact devices mounted to equipment that capture acceleration, velocity, and surface temperature at configurable intervals.
- Communication gateway: A bridge device that receives sensor data via short-range wireless protocol (typically Bluetooth Low Energy or similar) and transmits it to the cloud.
- Cloud dashboard: A web or mobile interface for viewing real-time and historical trends, setting threshold values, and receiving email or push notifications when thresholds are exceeded.
- Basic anomaly detection: Some platforms in this category use simple pattern recognition to flag when a data point falls outside a normal range, but the output is typically limited to "anomaly detected," without specifying the cause or severity.
Core diagnostic model
Diagnostics in this system type are performed by the user. The platform presents raw data and threshold-based alerts, but it does not identify specific failure modes, classify severity, or provide root cause analysis. If an alert fires, the maintenance team must investigate independently to determine what is happening and what action to take.
Path to action
Manual and external. When a threshold alert triggers, the user reviews the dashboard, interprets the data, and then creates a maintenance task in a separate system (a CMMS, spreadsheet, email, or verbal request). There is no automated connection between the monitoring platform and any maintenance execution tool.
Downsides
- No diagnostic intelligence: The system tells the team that something changed, but not what changed, why it changed, or what to do about it. Every alert requires independent investigation before any maintenance decision can be made.
- High interpretation burden: Without automated fault identification or severity classification, the value of the data depends entirely on the reviewer's skill and availability.
- No connection to maintenance workflows: Findings stay in the monitoring platform. Creating a work order, assigning a technician, and tracking resolution are all done manually in separate tools, creating latency between detection and action.
- Limited detection range: Sensors in this category typically operate within narrower frequency bands, which can miss high-frequency signatures associated with early-stage bearing wear, cavitation, and other faults detectable through ultrasonic or broadband vibration analysis.
What's the advantage?
Compared to having no condition monitoring system or relying solely on scheduled manual routes with handheld instruments, a sensor network with threshold alerting provides continuous data collection on assets that would otherwise go unmonitored between inspection visits. This alone can reveal developing problems days or weeks before a scheduled check would catch them.
Company match: Relay (Sensemore)
Relay (formerly Sensemore) provides wireless IIoT sensors with accelerometer, magnetometer, and thermometer capabilities. The sensors communicate via Bluetooth Low Energy to a gateway, which transmits data to a cloud platform for visualization and trend monitoring. The platform supports basic anomaly detection and data export. The system does not include automated fault diagnosis, prescriptive recommendations, or CMMS integration.
Analyst-Driven Monitoring Service
Best for: Facilities without in-house vibration analysis expertise that want a managed monitoring program in which an external specialist handles data interpretation and provides diagnostic recommendations.
How does it work?
An analyst-driven monitoring service is a condition-monitoring system in which wireless sensors collect machine data continuously, but the primary diagnostic value comes from a human analyst rather than from the software platform itself. The platform may include some machine-learning-assisted anomaly detection and risk ranking, but the prescriptive output, the specific recommendation on what is wrong and what to do, flows through a dedicated analyst who reviews the data, interprets it, and communicates findings to the customer's maintenance team.
Key technologies
This system type bundles hardware, a cloud platform, and a human service layer into a subscription. The technology stack includes sensors and data transmission, but the diagnostic weight rests on the analyst.
- Wireless vibration and temperature sensors: Triaxial accelerometers paired with temperature measurement, mounted to rotating equipment and transmitting data to a cloud platform.
- Communication hub: A local device that aggregates sensor data and transmits it to the cloud via Wi-Fi or cellular connection.
- Cloud platform with AI-assisted risk ranking: Software that ingests sensor data, applies anomaly detection algorithms, and presents asset health indicators (often color-coded severity levels) for the analyst to review.
- Dedicated human analyst: A certified vibration analyst (typically CAT III or IV) assigned to the customer's facility, who reviews platform data and delivers prescriptive maintenance recommendations through in-platform communication or reports.
Core diagnostic model
The analyst performs the diagnosis. The platform flags anomalies and ranks assets by risk level, but determining which specific failure mode is present, how severe it is, and what corrective action is appropriate requires a human analyst to review the data. Diagnostic confidence and throughput are tied to analyst availability and capacity rather than to the platform's autonomous reasoning.
Path to action
Analyst recommendation, executed externally. The analyst communicates findings and recommendations to the maintenance team through the platform's messaging tools or reports. From there, the team creates work orders and schedules maintenance in a separate system. There is no native CMMS and no automated work order generation within the platform.
Downsides
- Diagnostic throughput is constrained by analyst capacity: The speed and depth of recommendations depend on one person's availability and workload. As monitored asset counts grow, the analyst can become a bottleneck, slowing the entire program's response time.
- Internal capability doesn't develop: Because the diagnostic intelligence lives with the vendor's analyst rather than within the organization's own team or platform, the facility remains dependent on external interpretation for as long as the service is active.
- No native path to maintenance execution: Recommendations arrive through in-platform messaging or reports, but converting them into scheduled work orders, assigned tasks, and tracked completions still requires a separate system and manual effort.
- Narrower sensing parameters: Sensors in this category typically measure vibration and temperature without dedicated ultrasonic, magnetic-field, or multimodal capabilities, which can limit the detection of certain fault types, particularly on low-speed or electrically driven equipment.
What's the advantage?
Over a sensor network with threshold alerting, the analyst-driven model adds a diagnostic layer that converts raw data into specific maintenance recommendations. Instead of reviewing a dashboard and deciding what an alert means, the maintenance team receives interpreted findings with suggested actions.
The trade-off is that diagnostic intelligence lives with the vendor, not the organization. The speed and depth of insights depend on the analyst's capacity and availability. As monitoring programs grow to cover more assets, the throughput of a single analyst can become a constraint. And because the organization relies on external interpretation, it doesn't build the internal reliability knowledge needed to operate independently over time.
Company match: AssetWatch
AssetWatch provides a condition monitoring service that bundles wireless vibration and temperature sensors with a cloud platform and a Condition Monitoring Engineer (CME) assigned to each facility. The sensor captures triaxial vibration data at a configurable frequency limit of up to 10 kHz. The platform includes anomaly detection and asset risk ranking, while the CME reviews data and delivers recommendations through in-platform communication. The system does not include a native CMMS, and work order creation requires third-party tools or manual processes.
Diagnostic Platform with Managed Expert Overlay
Best for: Organizations that want fault detection and prescriptive diagnostics at scale but operate within a managed service model where vendor experts validate findings and guide the customer toward action.
How does it work?
A diagnostic platform with a managed expert overlay is a condition-monitoring system in which the software performs automated fault detection, root-cause identification, and prescriptive recommendations using trained machine-learning models. The software handles the bulk of diagnostic work, but the delivery model layers human expert review on top to validate, prioritize, and handle complex cases.
The platform may include portfolio-level dashboards, risk scoring, and severity classification, but the path from diagnostic insight to maintenance action typically involves a handoff to the customer's existing maintenance platform or a manual process rather than a direct workflow trigger within the same system.
Key technologies
This system type combines purpose-built sensor hardware with an AI analytics platform and a managed service layer. The technology stack is deeper than the analyst-driven model because the software itself performs diagnostic reasoning.
- Multi-signal wireless sensors: Devices that capture vibration, temperature, and magnetic field data, sometimes with edge-AI processing capability for on-device analysis before cloud transmission.
- IoT gateway with mesh networking: Industrial gateways that aggregate data from multiple sensors and transmit to the cloud, often supporting mesh topologies where sensors relay data between each other.
- AI-powered diagnostic platform: Cloud software trained on large datasets that performs automated fault detection, prescriptive recommendations, severity scoring, and root cause identification. The AI output is the primary diagnostic product.
- Managed expert service: Vendor-employed reliability engineers or analysts who review AI output, validate findings for complex cases, and provide contextual guidance to the customer. Some providers back their diagnostic accuracy with insurance-based guarantees.
- Portfolio-level dashboards: Multi-site visibility tools that aggregate machine health status across facilities, supporting reliability leaders managing distributed operations.
Core diagnostic model
Software-driven with expert validation. The platform's machine learning models perform fault detection and prescriptive diagnostics autonomously. Vendor experts review output for accuracy, handle edge cases, and communicate findings to the customer. The customer's maintenance team receives validated recommendations but may have limited visibility into the AI's underlying diagnostic reasoning, such as the specific frequency signatures or spectral evidence that led to a conclusion.
Path to action
Handoff to external CMMS or manual process. The platform identifies and diagnoses faults, but creating a work order, assigning a technician, attaching procedures, and tracking completion happen outside the system. Teams must bridge the gap between the monitoring platform and their maintenance execution tools, either through third-party API integrations or manual processes.
Downsides
- Execution gap between diagnosis and action: The platform identifies faults and recommends corrective actions, but creating a work order, assigning the task, attaching procedures, and tracking completion all happen in a separate system. This handoff introduces latency and depends on manual steps to bridge.
- Limited transparency into diagnostic reasoning: Much of the intelligence lives inside proprietary AI models. In-house reliability engineers may find it difficult to access the underlying frequency data, spectral evidence, or fault reasoning needed to validate the system's conclusions or learn from them.
- Vendor dependency scales with the program: As monitoring expands to more assets and sites, reliance on the vendor's analyst capacity, integration support, and commercial terms grows proportionally, which can constrain flexibility for teams seeking to build internal reliability capability.
- Separate hardware required for specialized monitoring: Monitoring low-speed or ultra-low RPM equipment may require a different sensor model from the primary vibration sensor, adding procurement complexity and potentially different data pipelines within the same platform.
What's the advantage?
In an analyst-driven monitoring service, the software diagnostic model shifts the primary diagnostic workload from a human analyst to a trained algorithm. This means the system can process a larger volume of assets without the same throughput constraints that limit an individual analyst.
The structural trade-off is that the path from diagnosis to maintenance action remains disconnected. The platform tells the team what is wrong and what to do, but it doesn't create the work order, assign the technician, or track the resolution. That work still happens in a separate system.
For teams managing many monitored assets, this handoff introduces latency between detecting a problem and acting on it. Additionally, the managed service model means that as monitoring programs expand, reliance on the vendor's analyst capacity, integration support, and renewal terms grows proportionally, which can limit flexibility for teams that want to internalize reliability practices over time.
Company match: Augury
Augury provides machine health monitoring with vibration, temperature, and magnetic field sensing delivered as a managed service. The sensors communicate via Bluetooth mesh to gateways. A separate ultrasonic sensor monitors equipment operating between 1 and 150 RPM. The platform performs automated fault detection and provides diagnostic recommendations, supported by vendor analysts who review findings. The platform does not include a native CMMS or APM module, and maintenance execution requires integration with third-party systems.
Assembled Monitoring and Maintenance Ecosystem
Best for: Teams that want the structural loop from sensor data to work order execution within a single vendor relationship and are comfortable with a system whose components were developed or acquired independently and later integrated.
How does it work?
An assembled monitoring and maintenance ecosystem is a condition-monitoring system in which sensors, diagnostic software, and a CMMS are within the same vendor's portfolio, creating a clear path from detection to maintenance execution. The sensor data feeds into an analytics platform, which connects to a CMMS for work order generation, scheduling, and tracking. The full loop from condition insight to maintenance action is possible with a single vendor's products. However, the components were typically developed separately or acquired through different transactions and connected after the fact, so integration may require configuration, and the user experience across modules can vary.
Key technologies
This system type spans hardware, analytics, and maintenance management software. The distinguishing characteristic is that all three fall under a single vendor umbrella, even though they weren't built together or for one another.
- Wireless vibration sensors: Sensors that capture triaxial vibration and temperature data and transmit it to a gateway.
- Communication gateway: A device that aggregates sensor data and transmits it to the cloud via Wi-Fi, Ethernet, or cellular connection. Gateway capacity and communication protocol vary by product line.
- AI-powered analytics platform: Software that processes sensor data for fault detection, trend analysis, and diagnostic reporting. The model may be trained on collected vibration data.
- CMMS (separately developed): A maintenance management system within the same vendor's portfolio that handles work orders, preventive maintenance scheduling, inventory, and reporting. The CMMS connects to the analytics platform through an integration layer rather than being natively built into the same application.
- Alignment and auxiliary tools: Some providers in this category include additional measurement and alignment hardware in their portfolios. Therefore, their resources may not be dedicated to full maintenance execution lifecycles and view the products as part of a larger revenue portfolio.
Core diagnostic model
Software or analyst-driven diagnostics, depending on the product tier and configuration. The analytics platform uses machine learning to identify faults and may offer remote condition-monitoring services in which vendor analysts review data. Diagnostic output is delivered through the analytics portal, and the user or an integration layer routes the finding to the CMMS for action.
Path to action
Work orders are generated via an integrated (but separately built) execution platform. The structural connection between the monitoring and execution platforms allows diagnostic findings to flow into maintenance workflows. However, because the monitoring and CMMS sides were designed with different architectures, their integration may require data translation, configuration, or navigation between distinct interfaces.
The user experience across the monitoring and execution components may not feel like a single platform. Often, the experience is compared to attempting to ‘update’ or ‘modernize’ legacy software through custom integration.
Downsides
- Integration friction between components: Because the monitoring platform and the CMMS were built independently and connected later, data may need to be translated between systems. Navigation, terminology, and workflow logic can differ between the monitoring and maintenance sides.
- Recency of integration: When the connection between a vendor's monitoring and CMMS products was established recently, teams should evaluate how mature the integration is, whether it requires configuration or middleware, and whether it operates automatically or involves manual steps.
- Narrower sensing capabilities: Sensors in this category may measure only vibration and temperature, without dedicated ultrasonic transducers or magnetometers for RPM encoding and electrical fault detection. This limits the range of failure modes the system can detect autonomously.
- Lower gateway density and Wi-Fi dependency: Communication architectures that rely on Wi-Fi or Ethernet and support fewer sensors per gateway can require more infrastructure planning, IT coordination, and hardware to achieve the same plant coverage as systems using sub-GHz or cellular backhaul.
What's the advantage?
On a diagnostic platform with a managed expert overlay, the assembled ecosystem closes the structural gap between diagnosis and execution. Instead of handing off a finding to a separate CMMS, the vendor's portfolio includes both sides of the workflow. This means a diagnostic insight can become a work order without switching vendors or building a custom integration from scratch.
The trade-off is that "assembled" and "native" are not the same thing. When the monitoring platform and the CMMS were built independently and later connected, friction can arise at the integration points. Data may need to be translated between systems. The terminology, navigation, and workflow logic may differ between the monitoring and maintenance interfaces.
Teams evaluating this system type should assess how recently the integration was established, how the user experience flows across components, and whether the path from alert to work order is automatic or requires manual steps within the vendor's own products.
Company match: Fluke Reliability
Fluke provides condition monitoring through a vibration sensor connected to a CMMS and analytics platform assembled through separate acquisitions. The sensor combines a piezoelectric sensor with two MEMS sensors to capture triaxial vibration and temperature data across a frequency range of 2 to 10,000 Hz. The gateway communicates via Wi-Fi or Ethernet and supports up to 20 sensors.
Closed-Loop Condition Intelligence and Execution Platform
Best for: Industrial teams that need a single, technician-first platform where asset health intelligence and daily maintenance work operate together without handoffs, external tools, or middleware.
How does it work?
A closed-loop condition intelligence and execution platform is a condition-monitoring system in which sensor hardware, AI-powered diagnostics, a maintenance execution platform, and asset performance management are designed and built together as a single, unified product. Data flows from sensors to diagnostics, to work orders, to completed maintenance actions, and back into the diagnostic model, forming a continuous loop.
The system doesn't just detect and diagnose. It creates the work order, attaches the recommended procedure, assigns the task, tracks the resolution, and uses the outcome to refine future diagnostics. Every step happens within the same platform, and no external tools, handoffs, or integration projects are required to close the loop.
Key technologies
This system type represents the full technology stack in the condition-monitoring spectrum, with every component built natively and connected from the ground up.
- Multi-modal wireless sensors: A single sensor device incorporating vibration measurement (with sampling rate up to 64 kHz), ultrasound (up to 200 kHz for early-stage lubrication issue detection), magnetometer (for high-precision RPM measurements up to 15,000 RPM), and surface temperature measurement (from -40 °F to 250 °F). Multi-modal sensing in one device eliminates the need for separate sensors to cover different detection techniques.
- Sub-GHz wireless communication with cellular backhaul: Sensors communicate via IEEE 802.15.4g on sub-GHz frequencies to an industrial receiver, which transmits to the cloud over 4G/LTE. This architecture eliminates dependence on plant Wi-Fi and supports up to 100 sensors per receiver, with an indoor range of 330 feet and a line-of-sight range of approximately 0.6 miles.
- AI-powered auto-diagnosis with patented fault detection: Algorithms trained on over 3.5 billion collected samples that automatically identify all major failure modes, generate specific diagnoses, classify severity, and attach prescriptive maintenance procedures. The AI uses human-in-the-loop feedback to continuously improve its accuracy based on verified maintenance outcomes.
- Native Maintenance Execution: The CMMS is built into the same platform, including work order lifecycle management, preventive maintenance scheduling, inventory tracking, mobile execution with offline access, team communication, QR code scanning, and AI-generated SOPs.
- Asset Performance Management (APM): Failure mode and effects analysis (FMEA), root cause analysis (RCA), inspection management, criticality-based alert timing aligned with the P-F curve, and machine benchmarking at the self, intra-company, and industry-wide levels.
- Patented capabilities for complex assets: Always Listening mode for intermittent machines, RPM Encoder for variable-speed equipment, and Ultrasync for multi-sensor correlation on the same asset.
Core diagnostic model
AI-driven with closed-loop learning. The platform's patented fault-finding algorithms autonomously detect and diagnose failure modes, classify their severity, and generate prescriptive recommendations with attached procedures. When the recommended maintenance action is completed and verified, the outcome feeds back into the diagnostic model. This means the system's accuracy improves over time for each specific facility and asset. For complex alerts, supervised analysis provides expert-validated reports to complement the AI output.
Path to action
Native, automatic, and within the same platform. When a fault is detected, the system generates a prioritized work order in the CMMS with the diagnosis, severity level, and recommended procedure already attached. The technician receives the alert on the mobile app, sees exactly what is wrong, how critical it is, and what steps to take. When the work is complete, that outcome updates the asset's health record, reliability metrics, and the AI's diagnostic baseline.
No handoff. No separate system. No re-entry of data.
Benefits
- Detection to resolution in one platform: Every step from sensor reading to completed work order happens in the same interface, eliminating the latency, data loss, and manual effort that comes with bridging separate systems.
- Diagnostic accuracy that improves over time: The closed-loop feedback mechanism makes the system more tailored and precise to each facility's specific equipment and operating conditions, the longer it is in use.
- Scalable without adding expertise: AI-driven diagnostics handle growing asset fleets without requiring proportional increases in analyst headcount or vibration expertise. The platform provides the diagnostic intelligence that generalist technicians can act on directly.
- Comprehensive asset health management: Multi-modal sensing, AI diagnostics, native CMMS, and APM in a single ecosystem provide a complete picture of asset condition, maintenance execution, and reliability strategy without stitching together tools from multiple vendors.
What's the advantage?
The closed-loop model eliminates friction from assembling products built independently. Because every component was designed as part of the same platform, data flows without translation. The user experience is consistent across the monitoring dashboard, the work order screen, and the mobile app. And the feedback loop, where completed maintenance outcomes refine future diagnostic accuracy, is automatic rather than something the team has to build or maintain.
The broader structural advantage across the entire spectrum is that this system type handles the largest share of the condition monitoring workflow autonomously. It doesn't require the user to interpret threshold alerts (Type 1), wait for an analyst to review data (Type 2), bridge a gap between the diagnostic platform and a separate CMMS (Types 3 and 4), or manage the integration between components that were assembled after the fact (Type 4).
For teams facing the combination of growing asset counts, shrinking expert availability, and increasing pressure to demonstrate maintenance ROI, a closed-loop system delivers the most capability with the least dependency on manual effort and external resources.
Company match: Tractian
Tractian combines next-generation wireless vibration sensors with an AI-powered monitoring platform, a native CMMS, and an Asset Performance Management module in a single ecosystem.
The vibration sensor incorporates vibration measurement (0-64,000 Hz), ultrasound (up to 200 kHz), magnetometer, and temperature in one industrial-grade device rated IP69K and certified for ATEX/IECEx/NFPA 70 Class 1, 2, and 3 (all Division I) hazardous locations. Patented Auto Diagnosis algorithms detect all major failure modes and generate prescriptive alerts with severity classification and attached maintenance procedures from a built-in Procedures Library.
The native maintenance execution supports automatic work order generation from sensor insights, mobile execution with offline access, QR code scanning, AI-generated SOPs, and built-in team communication. The APM module provides FMEA tools, root cause analysis, failure libraries, inspection management, and machine benchmarking at the self, intra-company, and industry levels.
Tractian's AI is trained on 3.5+ billion samples with human-in-the-loop feedback, and the platform uses sub-GHz wireless communication with 4G/LTE cellular backhaul, requiring no dependence on plant Wi-Fi infrastructure.
Ready to see the difference a unified condition monitoring system makes?
Explore Tractian condition monitoring platform to discover what your team can achieve when sensor data, AI diagnostics, and maintenance execution work together as one connected system.
What Industries Benefit from Closed-Loop Condition Monitoring Systems?
Closed-loop condition monitoring systems deliver the greatest value in industries where unplanned equipment failures carry severe consequences for safety, production, and operating costs.
These are environments with large populations of critical rotating assets, tight production schedules, lean maintenance teams, and little tolerance for diagnostic uncertainty. In these settings, a system that detects a fault but can't tell the team what to do about it, or can't route that finding into a work order without manual effort, creates risk rather than reducing it.
- Mining and metals facilities operate crushers, conveyors, and mobile equipment in extreme conditions across remote, rugged locations. Closed-loop condition monitoring is critical in this industry because failures are dangerous, access is difficult, and the cost of an unplanned stoppage on a primary crusher or haul conveyor can cascade through the entire production chain. Systems that require manual interpretation or separate tools to act on findings don't match the pace or stakes of these operations.
- Chemical plants operate pumps, mixers, and compressors under tightly controlled process conditions, often in hazardous production areas where equipment failure can lead to safety incidents. Closed-loop systems matter here because early detection must directly lead to prioritized maintenance actions. A diagnostic finding that sits on a dashboard, waiting for someone to create a work order in a separate tool, is a liability in an environment where a delayed response can increase exposure risk.
- Mills and agriculture processors face compressed production windows during harvest and peak seasons, where equipment availability determines whether output targets are met. Closed-loop condition monitoring is essential because there is no margin to absorb the delay between detecting bearing wear or misalignment and getting a technician assigned to address it. Every hour spent bridging systems or waiting for an analyst's review is an hour closer to a breakdown during the window when it matters most.
- Manufacturing and industrial production teams run motors, gearboxes, conveyors, and robotics across mixing, forming, packaging, and assembly operations, where line uptime directly determines throughput. Closed-loop systems are important in this environment because the volume of monitored assets and the speed of production demand diagnostic intelligence that scales without adding headcount, and a direct path from detection to work order that keeps pace with the production schedule.
- Oil and gas refineries, midstream facilities, and upstream operations manage rotating equipment in remote and hazardous environments where access is restricted, safety requirements are strict, and the cost of unplanned downtime is measured in lost barrels and compliance exposure. Closed-loop condition monitoring is important here because the combination of asset criticality, regulatory scrutiny, and physical inaccessibility requires that diagnostic findings translate into action automatically. Systems that depend on manual handoffs or external analyst availability introduce unacceptable latency.
- Heavy equipment operators track maintenance across dispersed job sites where high-value mobile assets must remain available for time-sensitive projects. Closed-loop systems are critical because the assets are spread across locations, technician access is constrained, and a failure on a single machine can halt an entire project. A condition-monitoring program that requires centralized analyst review or separate CMMS tools to execute a finding doesn't scale across distributed operations.
- Food and beverage producers operate in washdown environments under strict hygiene and regulatory requirements where equipment failure can compromise temperature control, product quality, and contamination standards. Closed-loop condition monitoring is important in this industry because the consequences of missed or delayed diagnoses extend beyond downtime. They can include product recalls, regulatory action, and brand damage. Systems that close the loop between detection and corrective action reduce both mechanical risk and compliance exposure.
- Automotive and parts plants depend on high-precision machinery, robotics, and assembly lines operating on just-in-time production schedules where minutes of unplanned downtime disrupt delivery commitments. Closed-loop systems are essential here because the production model has no buffer for diagnostic delay. When a sensor detects a fault on a line-critical asset, the path from that detection to a technician with a work order and procedure must be immediate and automatic, not dependent on a separate tool or manual process.
FAQs About the Condition Monitoring Systems
- What is the difference between a condition monitoring sensor and a condition monitoring system?
A sensor is a hardware device that collects data from a machine. A condition monitoring system combines that sensor with software, diagnostic logic, and some path to action, whether manual or automated. The more of that path a system handles natively, the less manual effort your team needs to convert data into completed maintenance work.
- Does every condition monitoring system require a separate CMMS?
Most do. Systems in the first three categories on the spectrum rely on third-party CMMS platforms or manual processes to convert diagnostic findings into work orders. Only closed-loop platforms include native maintenance management, which eliminates the handoff between detection and execution.
- Can a simpler system type be enough for our operation?
It depends on how much manual interpretation and external tooling your team can absorb. Simpler systems require more labor to bridge the gap between an alert and a completed repair. If your team is lean, your asset count is growing, or your vibration expertise is limited, those gaps compound quickly.
- What if we already have a CMMS from another vendor?
Tractian's platform components, including condition-monitoring sensors, AI diagnostics, and APM, integrate with existing enterprise systems via an open API. Teams can adopt individual capabilities alongside their current CMMS and still benefit from automated diagnostics and prescriptive alerts. If the decision is made later to consolidate into a fully native closed-loop program, the transition is simpler because the monitoring and diagnostic layers are already in place.
- How do I know if my current system is limiting our reliability program?
Look for signs that your team spends more time interpreting data and coordinating between tools than acting on findings. If alerts require manual investigation before anyone knows what to do, if work orders are created in a separate system from where the diagnosis was made, or if diagnostic accuracy hasn't improved despite months of collected data, the system is likely creating more work than it eliminates.
- Why does the path from diagnosis to work order matter so much?
Because the value of detecting a fault is only realized when someone fixes it. Every handoff, re-entry, or tool switch between a diagnostic finding and a completed repair introduces delay, data loss, and the risk that the finding is deprioritized or forgotten entirely. Systems that close that path natively convert more detections into completed actions with less effort.